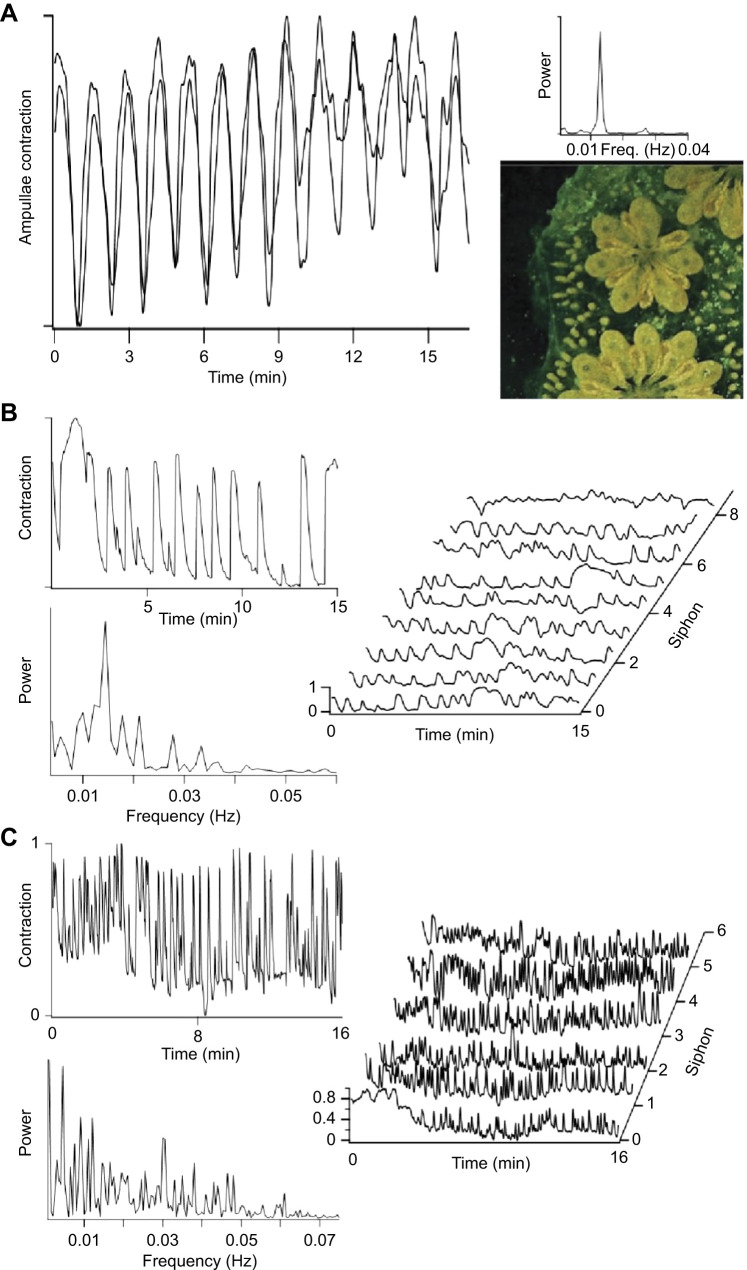
Fig. 4.
Synchrony in the vascular network. (A) Synchronous contraction in two ampullae spaced 5 mm apart in the same colony during a 17 min video recording. The periodogram of contractions (shown to the right) has a single peak at ∼0.013 Hz. The colony is in takeover and the photograph shows the swollen ampullae, degenerating zooids and developing primary buds characteristic of this developmental stage. (B) Movement recorded at the region of the oral siphon in a zooid nearing takeover (stage A4–A5). The periodogram of the movement also has a peak at ∼0.013 Hz indicating that the vascular network makes a strong contribution to timing the movement. The waterfall plot to the right shows contractions measured at all eight zooids in the module recorded over a 15-min period. The presence of both synchronous and asynchronous movements suggests contributions from both the vascular and nervous systems. (C) The same module imaged 4 days later, a time when the new zooids have matured and the neuron cell count is maximal (stage A3). Oral siphon contractions in one zooid are shown in the upper left panel. The periodogram (lower left panel) now has a broad frequency distribution with a much less obvious component at the frequency characteristic of the vascular network. The waterfall plot for six zooids shows a large amount of activity with little evidence of synchronous behavior.

