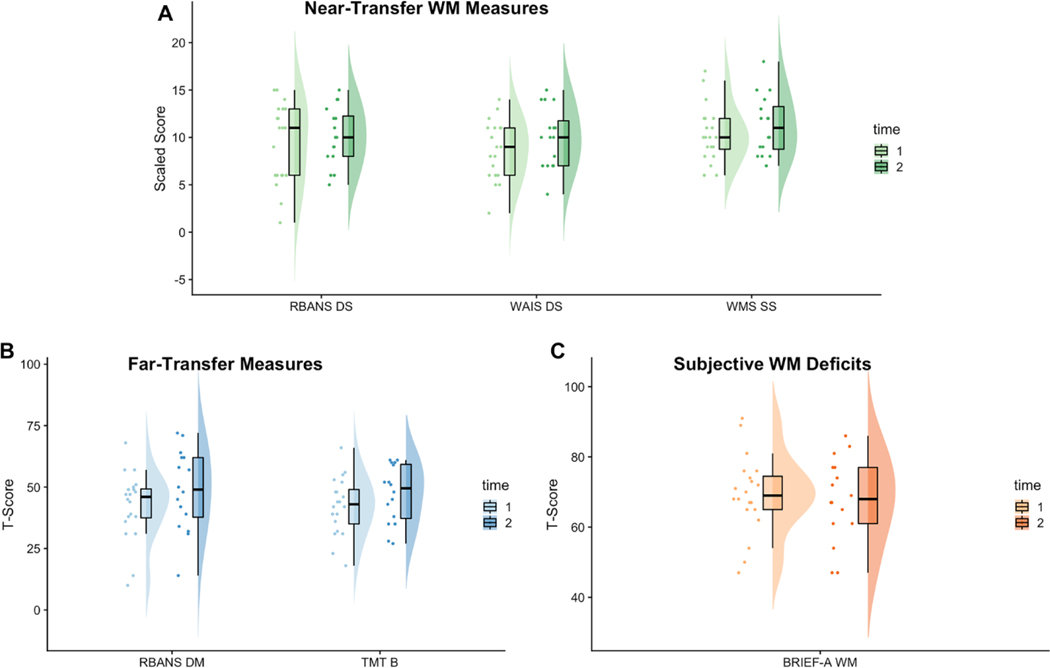
Fig. 2.
Scores on Outcome Measures from Baseline to Post-CWMT. Raincloud plots depict the distribution of scores on near-transfer (A, green), far-transfer (B, blue), and subjective working memory (C, orange) measures from baseline assessment (time 1, lighter shade) to post-CWMT (time 2, darker shade). Points represent individual patient scores and boxplots show the median and quartiles. RBANS DS RBANS Digit Span subtest, WAIS DS WAIS-IV Digit Span subtest, WMS SS WMS-IV Symbol span, RBANS DM RBANS Delayed Memory subtest, TMT B Trail Making Test B, BRIEF-A WM BRIEF-A Working Memory. †p<0.01, *p <0.05, **p<0.01

