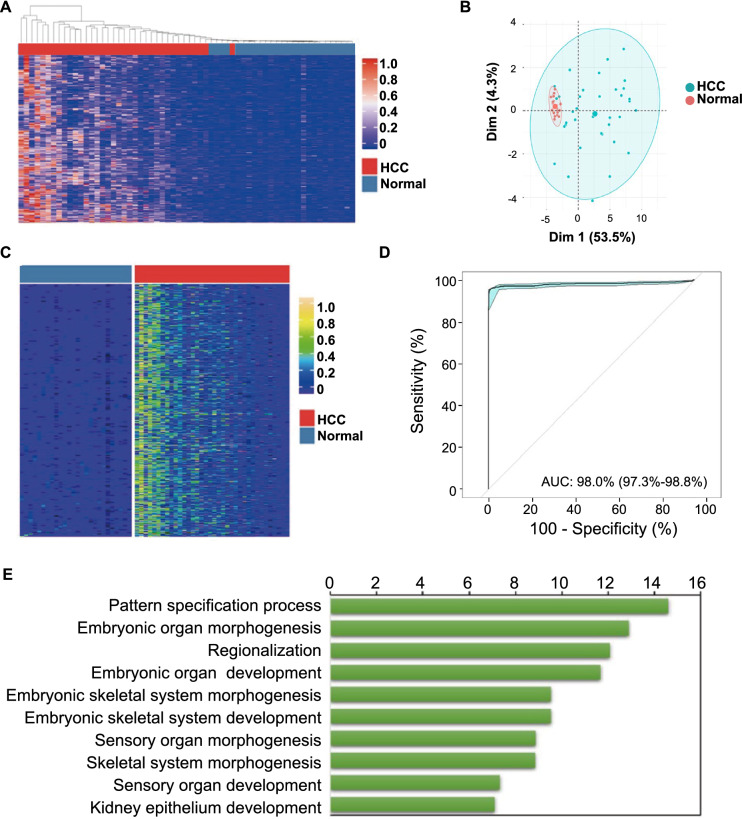
Fig. 2.
DNA methylation markers classify normal liver and HCC tissues with high degree of accuracy. A Unsupervised clustering of normal and HCC tissues based on top 100 MHBs that have the highest degree of variations in their MHL scores; B PCA analyses show clear separation between normal liver tissues and HCC tissues; C supervised analyses identified 65 MHBs as classifiers for normal liver tissues and HCC tissues; D RF-built classification models using the 65 MHB markers accurately classified normal liver tissues and HCC tissues, as was demonstrated by the AUC of their ROC curves; E top biological function categories of the identified MHB markers

