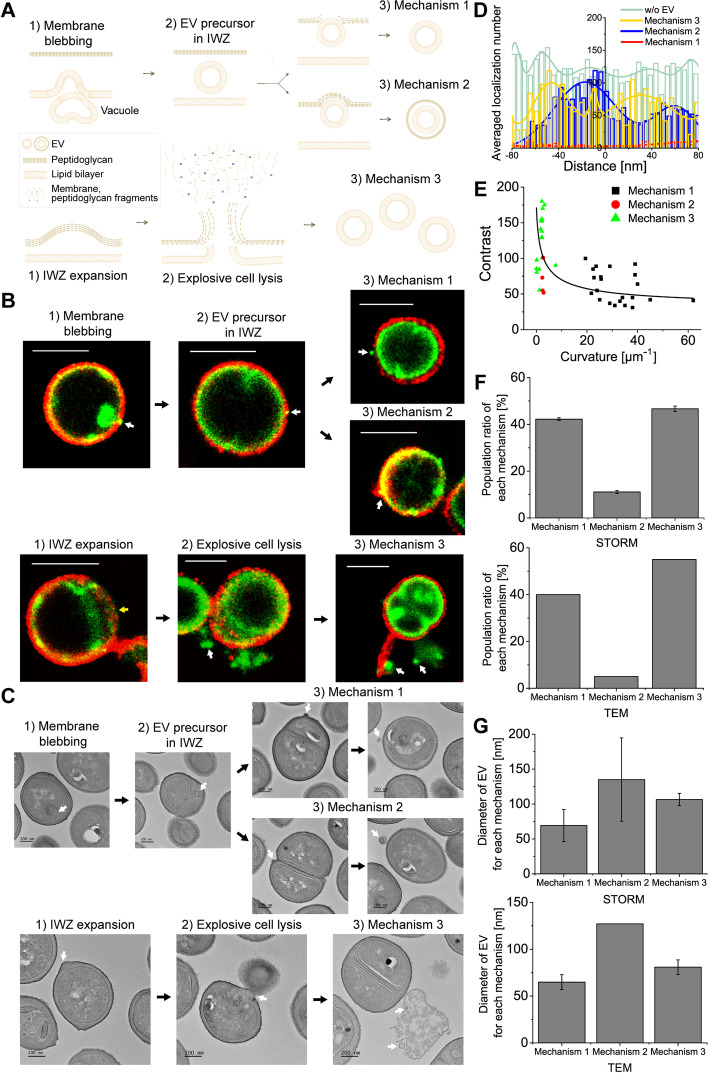
Fig. 3.
Proposed EV biogenesis mechanisms in gram-positive bacteria. A Proposed models for EV biogenesis in gram-positive bacteria. B, C Representative (B) multi-color STORM and (C) TEM images of S. aureus with EVs for each mechanism. Red: WGA. Green: Nile red. Yellow arrow: expanded IWZ. D Comparison of the cell wall density for each mechanism observed from STORM images. Averaged localization number in the cell wall was measured as the cell wall density from STORM images. E Relationship between the contrast and the curvature of the cell wall measured from TEM images. The fitting line obtained by the exponential function shows an inverse relation. F Population ratio of S. aureus producing EVs by each mechanism observed from multi-color STORM and TEM images (mean±SD; n=~1000 from STORM images, n=~80 from TEM images). G Comparison of the diameter of EVs produced by each mechanism observed from STORM and TEM images (mean±SD; n=~30). White arrows: observed EVs. Scale bars: 1 μm in B and 200 nm in C

