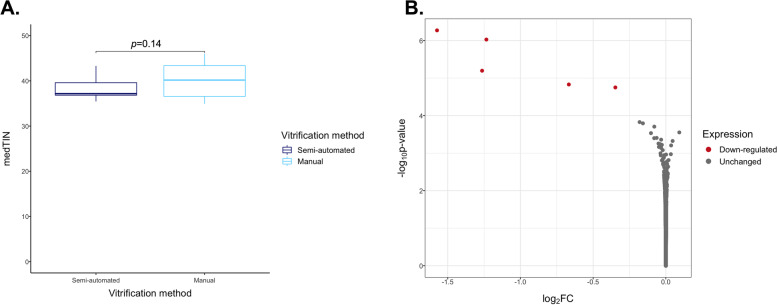
Fig. 4.
Differential gene expression and RNA quality of semi-automatically and manually vitrified oocytes. A Comparison of mean medTIN between semi-automated and manual vitrification groups. Significance was assessed using a linear mixed model with random effects. B Volcano plot representation of the differential expression analysis with semi-automated vitrification compared with manual vitrification (Semi-automated minus Manual). Each point represents one of the genes expressed with log2(FC) on the x-axis and –log10 of the unadjusted p-value calculated with DESeq2 on the y-axis

