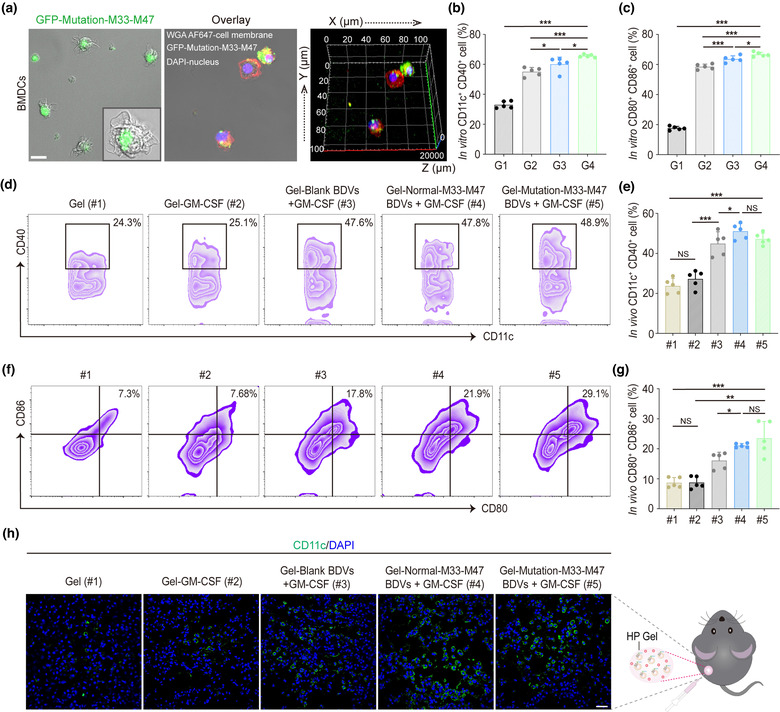
FIGURE 2.

Dendritic cell activity and maturation in vitro and in vivo. (a) Confocal 3D image of BMDCs uptake of GFP‐Mutation‐M33‐M47 E. coli BDVs in vitro (Scale bar: 10 μm). Green: BDVs. Red: cell membrane. Blue: cell nucleus. (b, c) Quantitative analysis of CD11c+ CD40+ cells (b) and mature DCs (c) from different treatment groups in vitro (gated on CD11c+ cells, n = 5). Error bar, mean ± s.d.. PBS (G1), Blank BDVs (G2), Normal‐M33‐M47 BDVs (G3), Mutation‐M33‐M47 BDVs (G4). (d, e) Representative flow cytometry data (d) and statistical data (e) to show CD11c+ CD40+ cells induced by different formulations of BDVs in vivo (in lymph nodes) on day 3 post‐ injection (gated on CD11c+ cells, n = 5). Cells were stained with anti‐CD11c‐APC, anti‐CD40‐PE antibodies (Biolegend). (f, g) Representative flow cytometry data (f) and statistical data (g) to show DC maturation induced by different formulations of BDVs in vivo (in lymph nodes) on day 3 post‐injection (gated on CD11c+ cells, n = 5). Cells were stained with anti‐CD11c‐APC, anti‐CD80‐FITC, anti‐CD86‐PE antibodies (Biolegend). Error bar, mean ± s.d.. (h) Immunofluorescence analysis of CD11c+ DCs in the skin after the treatments (Scale bar: 50 μm). Gel (#1), Gel‐GM‐CSF (#2), Gel‐Blank BDVs + GM‐CSF (#3), Gel‐Normal‐M33‐M47 BDVs + GM‐CSF (#4), Mutation‐M33‐M47 BDVs + GM‐CSF (#5). mean ± s.d., n = 5. NS: no significant, *P < 0.05, **P < 0.01, ***P < 0.001. One‐way ANOVA with Tukey post‐hoc tests (b, c, e, g)
