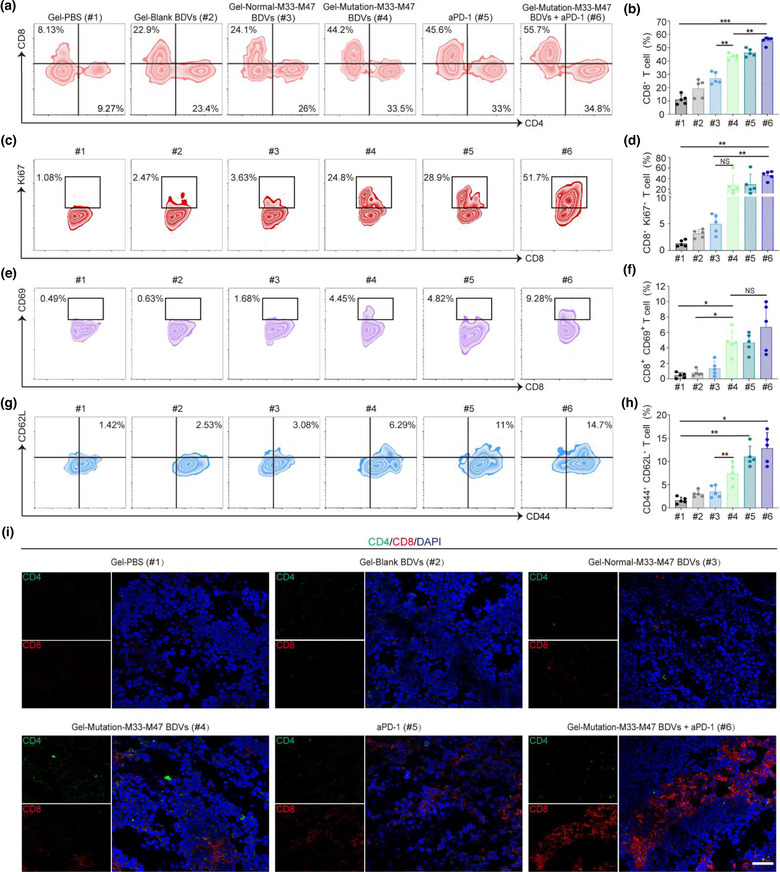
FIGURE 4.

BDV‐neoantigen vaccine induced a robust antitumour immune response. (a, b) Representative flow cytometry plots (a) and ratios (b) of different groups of T cells in the residual tumours from different groups (gated on CD3+ T cells, n = 5). Cells were stained with anti‐CD3‐FITC, anti‐CD4‐Brilliant Violet 421, anti‐CD8a‐APC/Fire750 antibodies (Biolegend). Error bar, mean ± s.d.. (c, d) Representative flow cytometry plots (c) and ratios (d) of different groups of CD8+ Ki67+ T cells in tumours (gated on CD3+ CD8+ T cells, n = 5). Cells were stained with anti‐CD3‐FITC, anti‐CD8‐APC/Fire750, anti‐Ki67‐Alexa Fluor® 647 antibodies (Biolegend). Error bar, mean ± s.d.. (e, f) Representative flow cytometry plots (e) and ratios (f) of different groups of CD8+ CD69+ T cells in tumours (Gated on CD3+ CD8+ T cells, n = 5). Cells were stained with anti‐CD3‐FITC, anti‐CD8‐APC/Fire750, anti‐CD69‐APC antibodies (Biolegend). Error bar, mean ± s.d.. (g, h) Representative flow cytometry plots (g) and ratios (h) of different groups of CD44+ CD62L+ T cells infiltrating in tumours (Gated on CD3+ CD8+ T cells, n = 5). Cells were stained with anti‐CD3‐FITC, anti‐CD8‐APC/Fire750, anti‐CD44‐PE, anti‐CD62L‐Alexa Fluor® 700 antibodies (Biolegend). Error bar, mean ± s.d.. (i) The immunofluorescence images of CD4+ CD8+ T cells infiltrating in tumours (Scale bar: 50 μm). (#1) Gel‐PBS, (#2) Gel‐Blank BDVs, (#3) Gel‐Normal‐M33‐M47 BDVs, (#4) Gel‐Mutation‐M33‐M47 BDVs, (#5) aPD‐1, (#6) Gel‐Mutation‐M33‐M47 BDVs + aPD‐1. Cells were stained with anti‐CD11c‐APC, anti‐CD40‐PE, anti‐CD80‐FITC and anti‐CD86‐PE antibodies (Biolegend). All samples were sorted using Beckman CytoFlex flow cytometer and analyzed with FlowJo software. NS: no significant, *P < 0.05, **P < 0.01, ***P < 0.001. One‐way ANOVA with Tukey post‐hoc tests (b, d, f, h)
