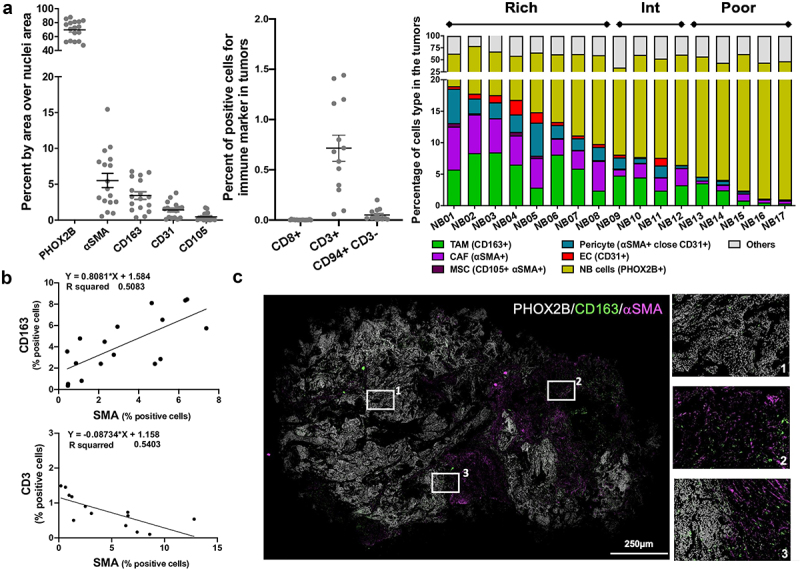
Figure 1.

TAM, CAF and MSC are the most abundant nonmalignant cells in the TME of NB tumors.
a. The data represent the percent of positive cells, identified by multi-IHC according to the indicated markers, per total number of cells in 17 (left) or 13 (middle) among 17 primary untreated NB tumors as analyzed by pixel area, and as described in Materials and Methods. Cells were identified as follows: PHOX2B+ for NB cells, CD163+ for TAM, αSMA+ adjacent to CD31+ for pericytes, αSMA+ nonadjacent from CD31+ for CAF, αSMA+CD105+ for MSC, CD31+ for endothelial cells (EC), CD8+ and CD3+ for T cells, CD94+CD3− for NK cells. Right: The stacked bar graph represents the percent of different cell types identified by indicated markers and colors in 17 primary untreated NB tumors. b. Scatter plot and correlation analysis between the percent of CD163+ (TAM) and αSMA+ cells (CAF) (top); and the percent of CD3+ T cells and αSMA+ cells (CAF) (bottom) in the primary untreated NB tumors presented in panel A. c. Left: Representative merged digital photomicrograph of a NB tumor (NB01) stained for the indicated markers (Bar = 250 μm). Right: Higher magnification of three inset areas shown on the left panel.
