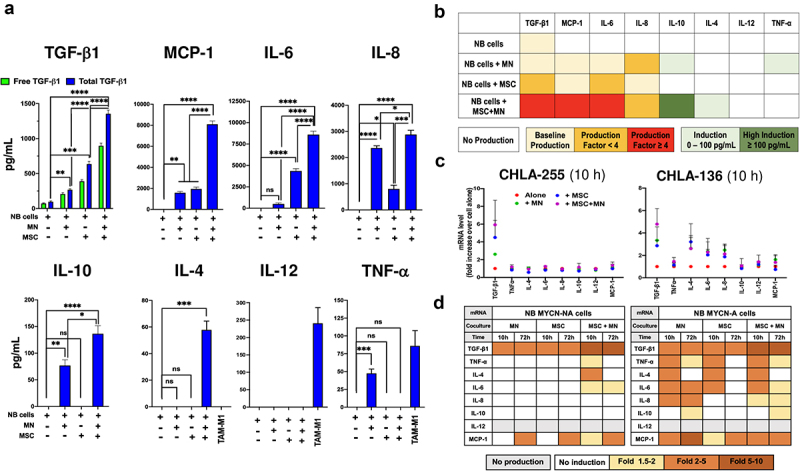
Figure 3.

CAF and TAM induce the production of cytokines/chemokines in NB cells.
a. Bar graph of mean ±SEM concentrations of the indicated cytokines/chemokines in the CM of NB cells (CHLA-255, SK-N-AS, SK-N-BE(2), CHLA-136) co-cultured for 72 h with MN, MSC, or both. Data were obtained from three independent experiments performed in technical duplicates for each NB cell line. The CM from MN pre-treated 7-d with GM-CSF (M1 polarization) was used as control for TNF-α, IL-4 and IL-12. The p-values were determined by two-way ANOVA (TGF-β1) or by Kruskal–Wallis test (other cytokines). ****p < .0001, ***p < .001, **p < .01, *p < .05, ns: not significant. b. Heatmap of the cytokines/chemokines data shown in panel A colored by categories representing fold ratio of cytokines/chemokines over baseline (cells alone). c. Dot plot of RT-qPCR analysis of mRNA collected from MYCN-NA NB cells (CHLA-255, SK-N-AS) and MYCN-A NB cells (SK-N-BE(2), CHLA-136) cultured alone, in dual or in triple co-cultures for 10 h or 72 h alone or in the presence of MN, MSC or their combination. The data represent the mean ±SD fold increase in mRNA for the indicated cytokines/chemokines in co-culture with MN or/and MSC over NB alone from three independent experiments performed in technical duplicates for CHLA-255 and CHLA-136 at 10 h. d. Heatmap of the data shown in panels C and Figure S3C colored according to the fold increase over baseline (NB cells alone).
