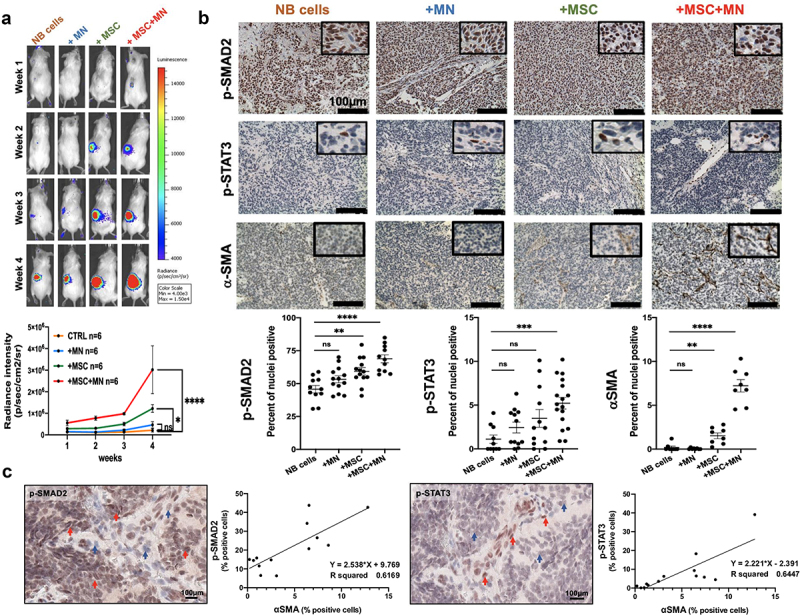
Figure 6.

TAM and CAF activate a TGF-β1-IL-6 signaling pathway in NB tumors.
a/b. NOD scid-gamma (NSG) mice were orthotopically implanted with CHLA-136-LUC NB cells and human MN, MSC or their combination as indicated in Materials and Methods. Tumor growth was monitored by bioluminescence and tumors were harvested after 3–4 weeks and examined by immunohistochemistry (IHC). a. Top: Bioluminescence images of a representative mouse bearing a CHLA-136-LUC tumor in conditions indicated at the top. The scale bar displays relative light units of radiance intensity. Bottom: The data represent the mean ±SD luminescence intensity over time from six mice per group in one experiment. b. Left: Representative photomicrographs of tumor sections for indicated phospho-proteins analyzed by IHC after 3–4 weeks (Bar = 100 μm). Right: The data represent the mean ±SD percent of nuclei positive for the indicated phospho-protein in NB cells after stromal cells were excluded counted in four microscopic fields from two to three sections obtained from two tumors in each group. The p-values were determined by Wilcoxon–Mann–Whitney test. ****p < .0001, ***p < .001, **p < .01, *p < .05, ns: not significant. c. Representative digital microphotographs of NB tumor sections stained for p-SMAD2 and p-STAT3 (Bar = 100 μm) and graphs representing the correlation between the percent of αSMA+ CAF and the percent of cells positive for the indicated phospho-proteins. The data were obtained from the mIHC analysis of the 13 NB tumors shown in Figure 1.
