. 2022 Dec 2;15(1):2149055. doi: 10.1080/19420862.2022.2149055

Figure 1.

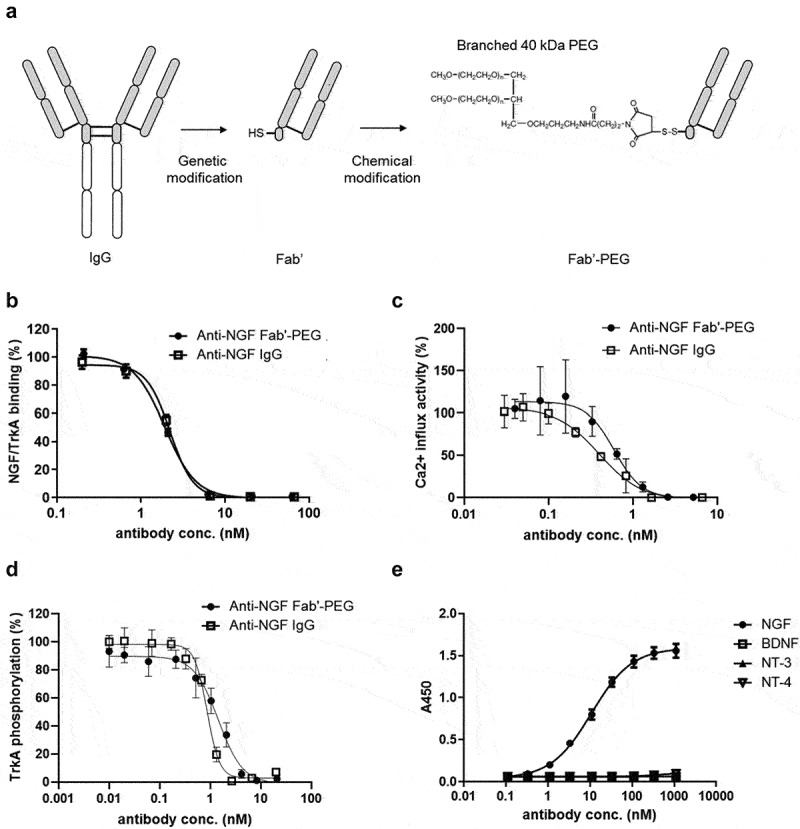
Part A shows a line drawing of the genetic modification of IgG into Fab’ and chemical modification into Fab’-PEG. Part B shows a plot of percent NGF/TrkA binding on the y-axis and concentration of anti-NGF Fab’-PEG and anti-NGF IgG on the x-axis. The graph shows that percent NGF/TrkA binding decreases with increasing concentrations of anti-NGF Fab’-PEG and anti-NGF IgG. Part C shows a plot of percent Ca2+ influx activity on the y-axis and anti-NGF Fab’-PEG and anti-NGF IgG concentration on the x-axis. The graph shows that percent Ca2+ influx activity dose-dependently decreases with antibody concentration. Part D shows a plots of percent TrkA phosphorylation on the y-axis and anti-NGF Fab’-PEG and anti-NGF IgG concentration on the x-axis. The graph shows that percent TrkA phosphorylation dose-dependently decreases with antibody concentration. Part E shows a plot of the absorbance measured at 450 nm on the y-axis and NGF, BDNF, NT-3 and NT-4 concentration on the x-axis. The graph demonstrates that only NGF shows a dose-dependent increase with antibody concentration.

Generation and characterization of a novel anti-NGF Fab’-PEG. (a) Scheme showing how the Fab’-PEG was generated. (b) Inhibitory activity of NGF/TrkA binding in competitive ELISA. (c) The inhibitory activity of NGF induced a calcium influx in TrkA-expressing HEK293 cells. (d) The inhibitory activity of NGF induced TrkA phosphorylation in TrkA-expressing HEK293 cells. Values indicate percent activity, with the effect of NGF alone (without antibody) representing 100%, and the basal activity without NGF or maximum concentration of anti-NGF Fab’-PEG defined as 0%. (e) Binding activity of the anti-NGF Fab’-PEG to human NGF, BDNF, NT-3 and NT-4. Values indicate absorbance at 450 nm. Data are presented as mean ± SD.