
Figure 2.
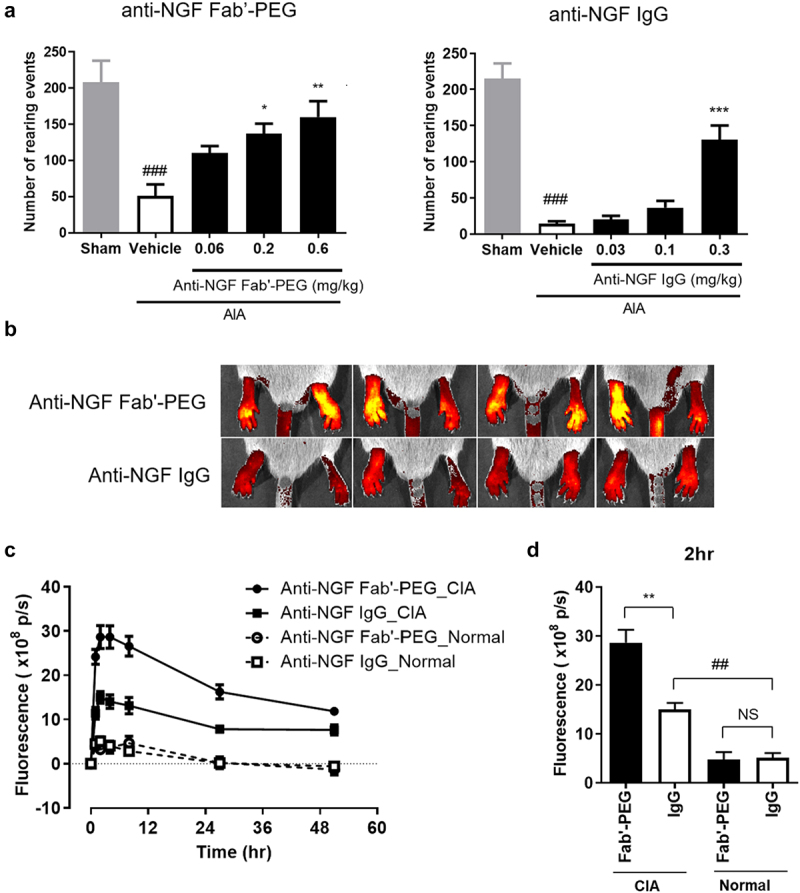
Analgesic effect and distribution of anti-NGF Fab’-PEG in arthritis models. (a) Analgesic effect of the anti-NGF Fab’-PEG and anti-NGF IgG in a murine AIA model. The number of rearing events was measured as an indicator of pain. Data are expressed as the mean ± SEM of 7–8 mice in each group. ### P < .001, statistically significant compared to the sham group (Student’s t-test). * P < .05, ** P < .01, *** P < .001, statistically significant compared to the vehicle group (Dunnett’s multiple comparisons test). (B, C, D) Biofluorescence imaging of the anti-NGF Fab’-PEG and anti-NGF IgG distribution in the inflamed paws of the murine CIA model. The images were captured and analyzed using the IVIS Spectrum in vivo imaging system (B, 2 hours after administration in CIA mice) and the fluorescence intensities were plotted at each time point. Change in fluorescence intensity (c) and fluorescence intensity 2 hours after administration (d). Data are expressed as the mean ± SEM of 4 mice in each group. ## P < .01, statistically significant compared to the anti-NGF IgG-Normal group. ** P < .01, statistically significant compared to the anti-NGF IgG-CIA group (Student’s t-test).