. 2022 Dec 2;15(1):2149055. doi: 10.1080/19420862.2022.2149055

Figure 3.

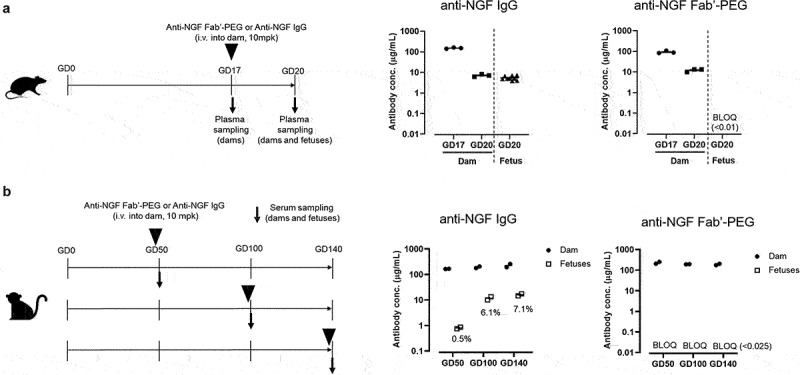
Part A shows the scheme of the study in rats. At GD 17, dams were administered anti-NGF IgG or anti-NGF Fab’-PEG and subjected to plasma sampling. On GD 20, dams and fetuses were subjected to plasma sampling. Two plots to the right of the scheme show the concentration of anti-NGF IgG and anti-NGF Fab’-PEG in the plasma of dams and fetuses. Part B shows the scheme of the study described in monkeys. On GD 49, 99 or 139, dams were administered anti-NGF IgG or anti-NGF Fab’-PEG. On GD 50, 100 or 140, dams and fetuses were subjected to serum sampling. Two plots to the right of the scheme show the concentration of anti-NGF IgG and anti-NGF Fab’-PEG in serum the serum of dams and fetuses. Mean serum concentration was 166 μg/mL on GD 50, 192 μg/mL on GD 100 and 226 μg/mL on GD 140 in dams administered anti-NGF IgG, and 0.8 μg/mL on GD 50, 11.7 μg/mL on GD 100 and 16.0 μg/mL on GD 140 in fetuses. Mean serum concentration was 229 μg/mL on GD 50, 195 μg/mL on GD 100 and 190 μg/mL on GD 140 in dams administered anti-NGF Fab’-PEG and below the limit of quantification in all fetuses.

Comparison of placental transfer of anti-NGF Fab’-PEG and anti-NGF IgG in rats and NHPs. (a) Scheme of the study design used to evaluate placental transfer in pregnant rats and the concentration of anti-NGF IgG or anti-NGF Fab’-PEG in plasma from rat dams and fetuses. Data are expressed as individual values and the mean ± SEM of 3 dams or 9 fetuses in each group. (b) Scheme of the study design used to evaluate placental transfer in pregnant cynomolgus monkeys and the concentration of anti-NGF IgG or anti-NGF Fab’-PEG in serum from cynomolgus monkey dams and fetuses. Data are expressed as individual values and the mean of 2 dams or 2 fetuses in each group. % values represent the proportion of the concentration of anti-NGF IgG in fetuses to dams.