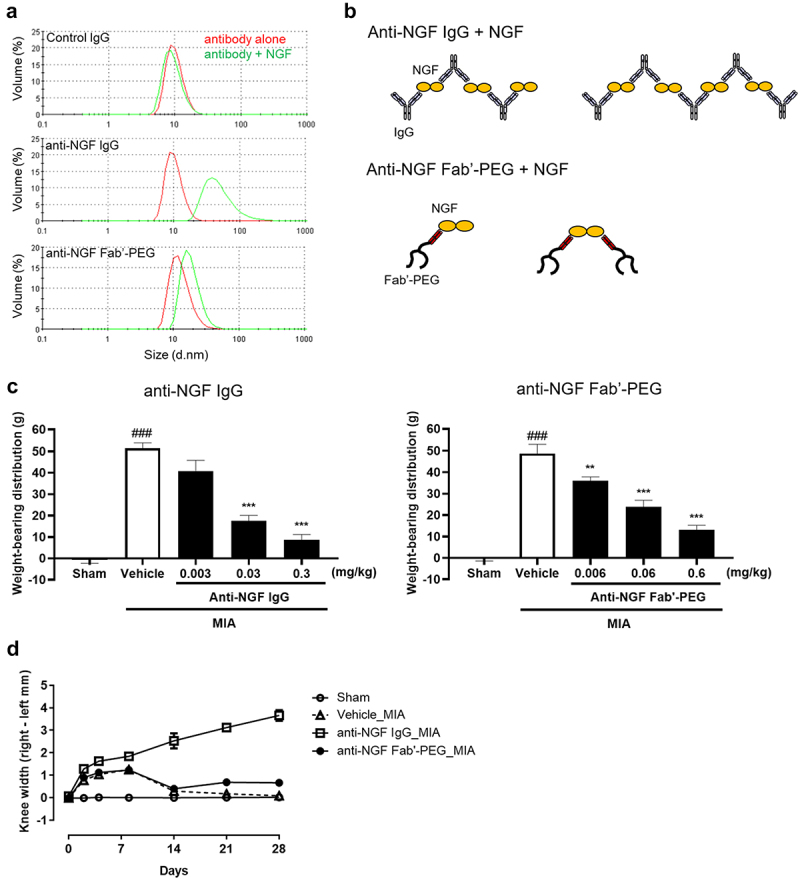
Figure 4.

Comparison of the immune complex-forming ability and knee edema induced by anti-NGF Fab’-PEG and anti-NGF IgG in a rat MIA model. (a) DLS analysis was used to detect the particle size of the immune complex formed by control IgG, anti-NGF IgG and anti-NGF Fab’-PEG. The volume particle size distributions of complexes formed by antibody alone (red) or a mixture of antibody and NGF (green) were measured using Zetasizer Nano. (b) Difference in immune complex formation between the anti-NGF IgG and anti-NGF Fab’-PEG. (c) Analgesic effects of the anti-NGF IgG or Fab’-PEG determined via assessment of hind paw weight-bearing in MIA rats. Data are presented as mean ± SEM of 8 rats in each group. ### P < .001 statistically significant compared to the sham group (Student’s t-test). ** P < .01 or *** P < .001, statistically significant compared to the vehicle group (Dunnett’s multiple comparisons test). (d) Knee diameter was assessed in MIA model rats on day 0, 2, 4, 8, 14, 21 and 28 post MIA injection. Rats were injected with 1 mg of MIA or saline (Sham) into the right knee. Anti-NGF IgG or PBS (Vehicle) was intravenously administered once (on day 2), or anti-NGF Fab’-PEG was intravenously administered 4 times (on day 2, 10, 18 and 26) after MIA injection. Knee width was determined by subtracting the value for the left side from that for the right. Data are presented as the mean ± SEM of 6 rats in each group.
