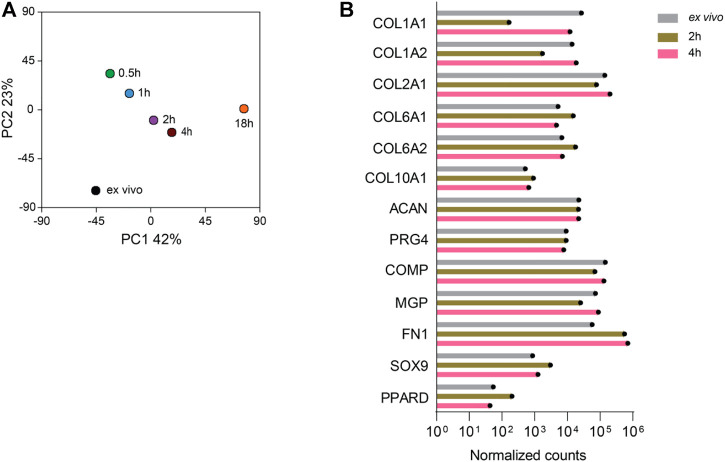
FIGURE 3.
The RNA sequencing profiles of chondrocytes isolated from cartilage by digestion for 2 and 4 h are closest to the RNA-seq profile of the chondrocytes obtained directly ex vivo. RNA-seq analysis was performed on chondrocytes harvested after digestion of cartilage with 2% collagenase II for 0.5, 1, 2, or 4 h and 0.1% collagenase II for 18 h. In addition, RNA was isolated directly ex vivo from the cartilage tissue of the same patient and sequenced. (A) The gene expression PCA plot provides a map of the distances between the samples as a measure of the differences between the RNA transcriptomes of the isolated cells and the chondrocytes in cartilage tissue ex vivo. (B) The expression of 13 hallmark genes of chondrocytes including COL1A1, COL1A2, COL2A1, COL6A1, COL6A2, COL10A1, ACAN, PRG4, COMP, MGP, FN1, SOX9, and PPARD in the ex vivo sample and after digestion for 2 and 4 h is plotted. Data were generated from the sample from one patient.

