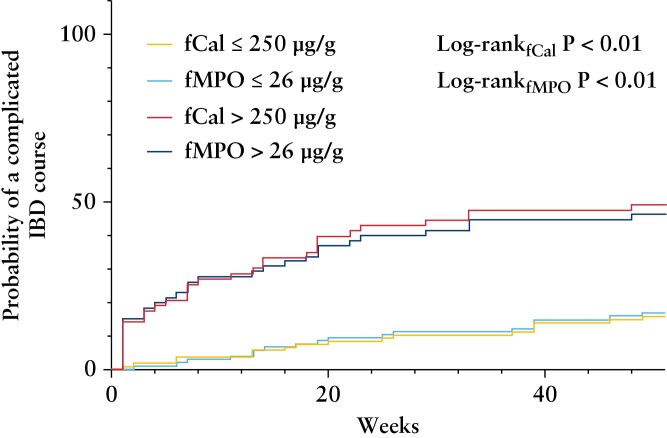
Figure 5.
Kaplan–Meier Curves showing differences in probability in reaching a composite outcome of escalation of immunomodulator/biologic therapy, corticosteroid use, IBD related hospitalisation, and surgery during 12 months of follow-up based on threshold values of baseline biomarkers [faecal calprotectin, fCal, >250 µg/g<; faecal myeloperoxidase, fMPO, fMPO > 26 µg/g<]. IBD, inflammatory bowel disease.

