
Extended Data Fig. 9 |. Experimental design, cell population consistency, and pathways analysis of the scRNA-seq experiment conducted on hippocampal BEC isolated from APP and CLU treated mice.
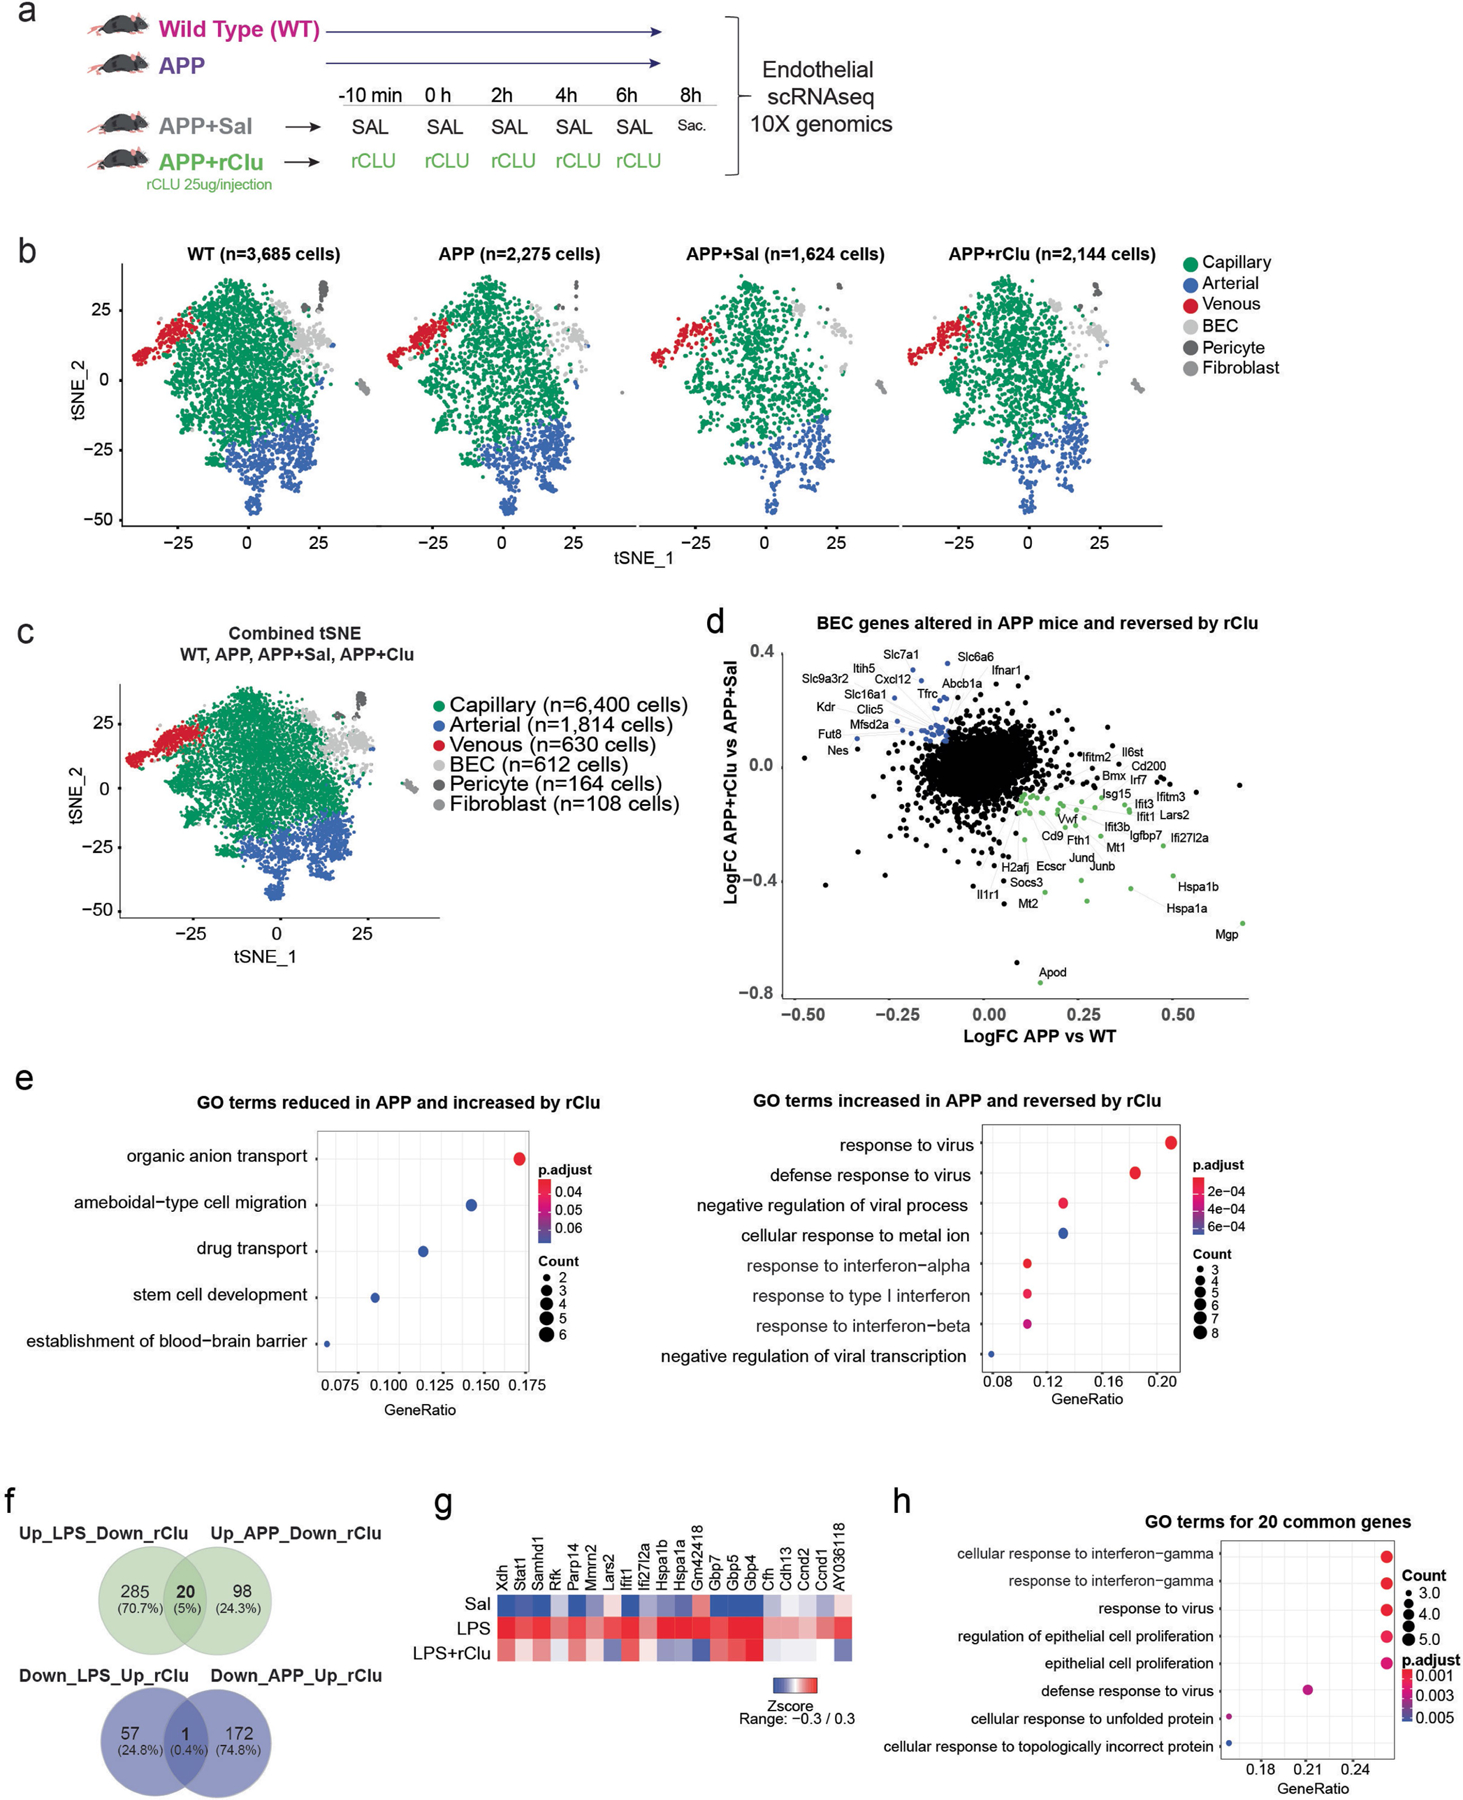
a, Schematic depicting the experimental paradigm followed for the injections of the four groups. 14-months-old male Wild Type (WT) and APP transgenic mice that received no treatment, 17-months-old male APP mice that received saline only injections (APP+Sal) or repetitive CLU injections (APP+Clu) (BECs were isolated from n = 4–5 per group). b, tSNE plots showing the cellular proportions, numbers, and distributions in the four experimental groups (WT, APP, APP+Sal, APP+Clu). c, tSNE plots show distribution of BECs among arterial, capillary, and venous cells by group. Combined tSNE plot for BECs sorted from 14-month-old male wild-type and APP transgenic mice and 17-month-old male APP mice treated with Saline or CLU (BECs sorted from n = 4–5 mice per group). (Cells labelled as BEC are of low quality and were excluded from differential expression analysis.). d, Scatter plots show a list of selected genes altered in BECs (arterial, capillary, and venous) by chronic (APP) inflammation and reversed by CLU treatment. Coloured genes represent genes that pass the cutoff fold change of 1.1. Green: Genes increased by inflammation and reversed by CLU. Blue: Genes reduced by inflammation and reversed by CLU. (Log FC: natural logarithm of fold change). e, Dotplot showing Gene Ontology (GO) Biological Processes terms for BEC genes (Benjamini–Hochberg adjustment test, FDR < 0.05) that decrease or increased in APP mice compared to wild types and are reversed by CLU. Genes were selected based on the cutoff fold change of 1.1. f, Venn Diagram showing the number of unique and common genes that are increased by LPS and APP and reversed by CLU and reduced by LPS and APP and reversed by CLU (Extended Data Fig. 8f,g and 9e). g, Heatmap showing the common 20 genes increased with acute (LPS) inflammation and reversed by rCLU treatment (from Extended Data Fig. 8e panel). h, Dot plot showing Gene Ontology (GO) Biological Processes terms for BEC genes (Benjamini–Hochberg adjustment test, FDR < 0.05) of the common genes (from panel f, left) that increased with acute (LPS) and chronic (APP) inflammation and are reversed by Clu treatment. The images in a were generated using MediaLab (https://medialab.biochem.wisc.edu/clip-art/).