
Fig. 2 |. RP counteracts LPS-induced neuroinflammation.
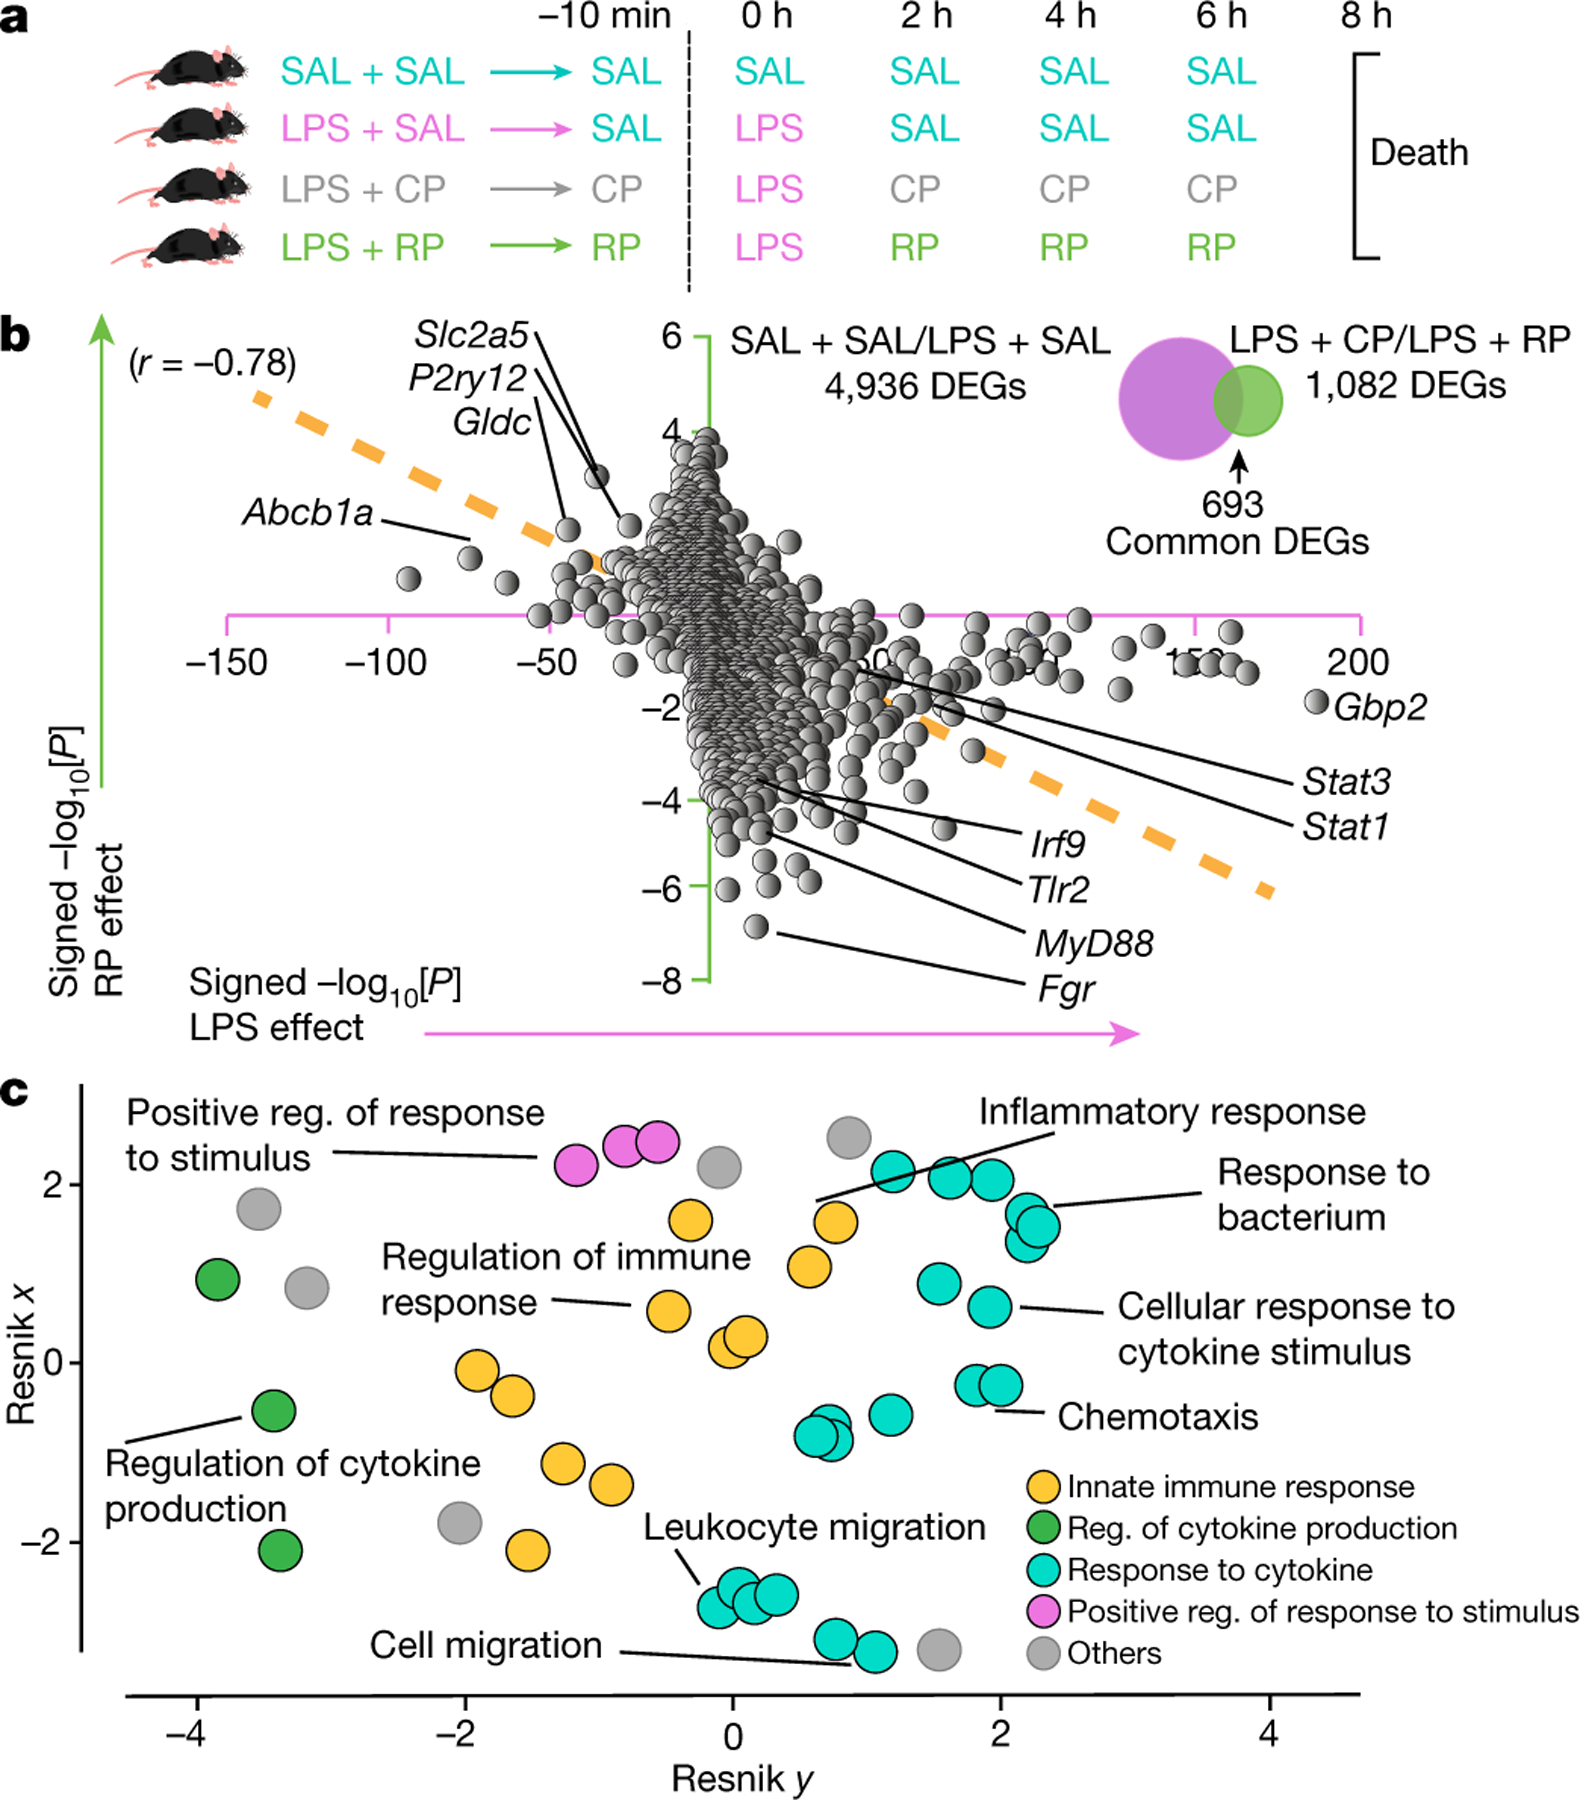
a, Male mice that were injected with LPS were treated with saline (SAL), RP or CP. An additional control group received SAL for all injections. b, Hippocampal DEGs shown as a correlation of the changes in signed −log10-transformed P values (Wald test, P < 0.05) with LPS (SAL + SAL (n = 8) versus LPS + SAL (n = 8)) and RP treatment (LPS + CP (n = 7) versus LPS + RP (n = 8)). c, Hierarchical networks of the abundance of GO terms (Fisher’s exact test, P < 0.05) related to biological processes using REVIGO (Resnik measurement, 0.7 distance). The GO terms correspond to the DEGs shown in b. Reg., regulation. The images in a were generated using MediaLab (https://medialab.biochem.wisc.edu/clip-art/).