
Fig. 3 |. Running alters complement and coagulation proteins.
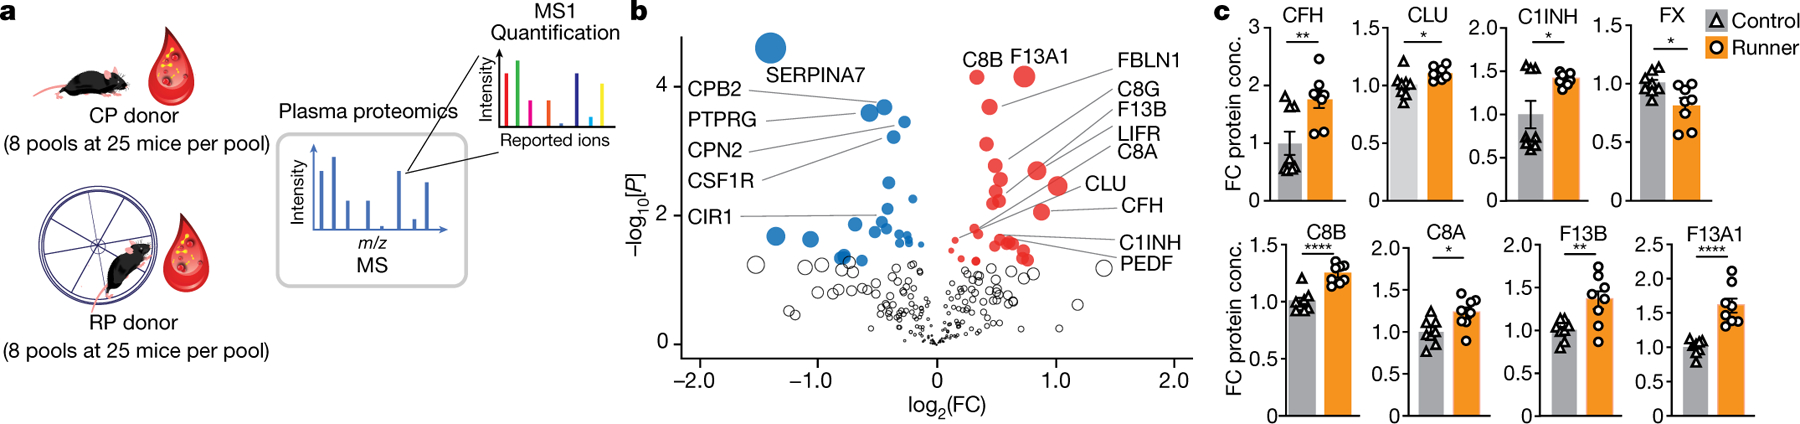
a, Eight pools of RP or CP (n = 25 male mice per pool) were collected, dialysed and analysed using shotgun LC–MS/MS. b, The downregulated (blue) and upregulated (red) proteins (Student’s two-tailed t-test, P < 0.05) in RP versus CP (n = 8 per group). The dot size represents the product of log2-transformed fold change and − log10-transformed P values. c, Complement and coagulation proteins significantly changed with running. Data are mean ± s.e.m. n = 8 per group. Statistical analysis was performed using unpaired Student’s two-tailed t-tests; *P < 0.05, **P < 0.01, ***P < 0.001, ****P < 0.0001. Conc., concentration. The images in a were generated using Freepik (https://www.freepik.com) and MediaLab (https://medialab.biochem.wisc.edu/clip-art/).