
Extended Data Fig. 3 |. Validation of changes in gene expression in response to runner plasma infusions and validation of changes in proteins with running.
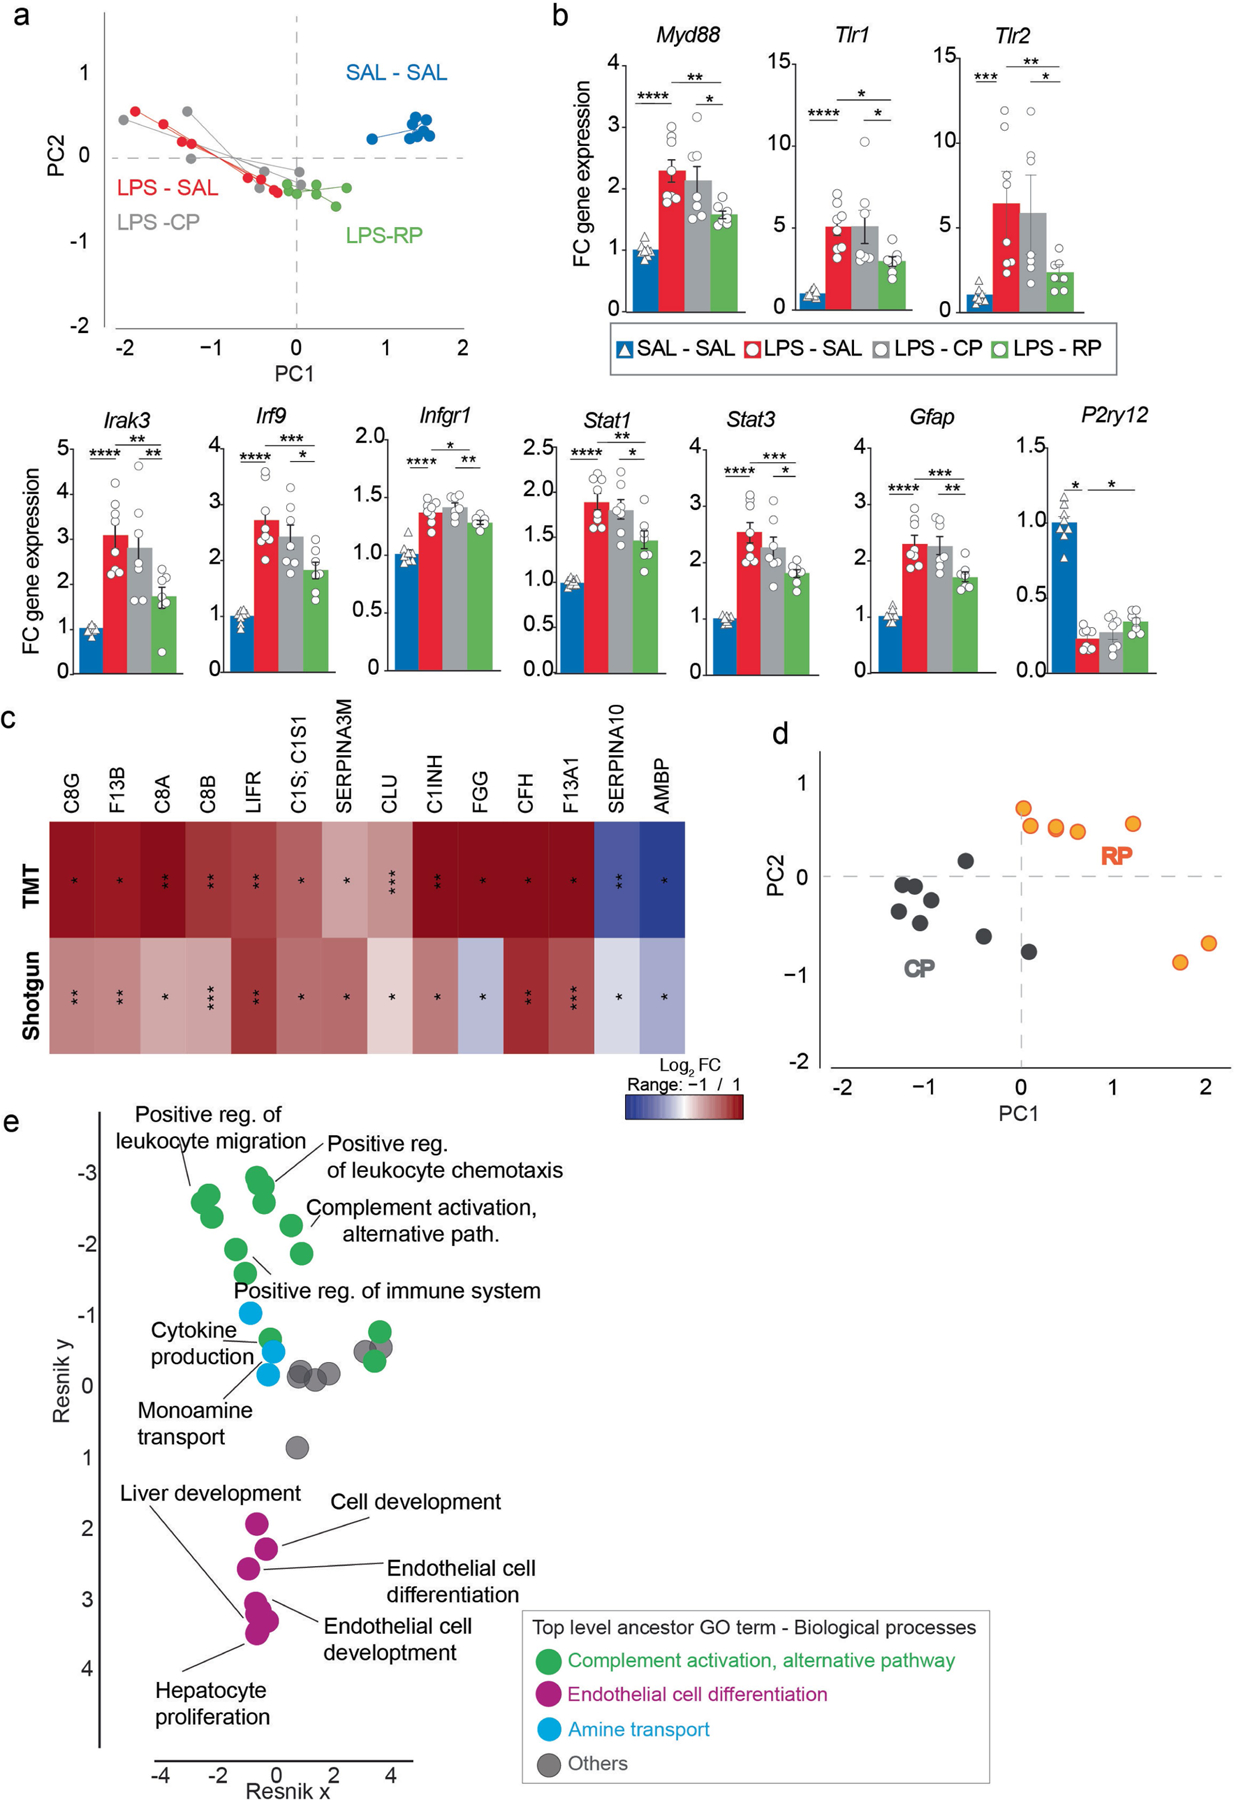
a, PCA analysis of common DEGs (Wald test, P < 0.05) induced by LPS (SAL-SAL (blue) vs. SAL-LPS (red) and by RP treatment (LPS-CP (grey) vs. LPS-RP (green)) (n = 7–8 per group). b, Graphs show fold changes of relative gene expression of indicated genes measured by qPCR (n = 7–8 per group). Means ± s.e.m; One-way ANOVA and Bonferroni post-hoc; * P < 0.05, ** P < 0.01, *** P < 0.001 and **** P < 0.0001. c, Validation of proteins captured with shotgun-LC MS1 using TMT-LC MS3 detection and analysis. Heat map depicting the relative levels of the top differentially expressed plasma proteins detected. Unpaired Student’s two-tailed t test; * P < 0.05, ** P < 0.01 and *** P < 0.001. d, Classification by PCA analysis using plasma proteins detected by Shotgun-LC-MS1 and significantly changed with running (unpaired Student’s two-tailed t test, P < 0.05). Data are Log2 transformed and missing values imputed by using the mean of each group. Control plasma (grey); runner plasma (orange). (n = 8 per group). e, Hierarchical networks of the abundance of gene ontology (GO) terms (Fisher’s exact test, P < 0.05) related to biological processes using REVIGO (Resnik measurement, 0.7 distance). GO terms correspond to the proteins significantly change with running when comparing CP with RP (unpaired Student’s two-tailed t test, P < 0.05) and shown in Fig. 3b.