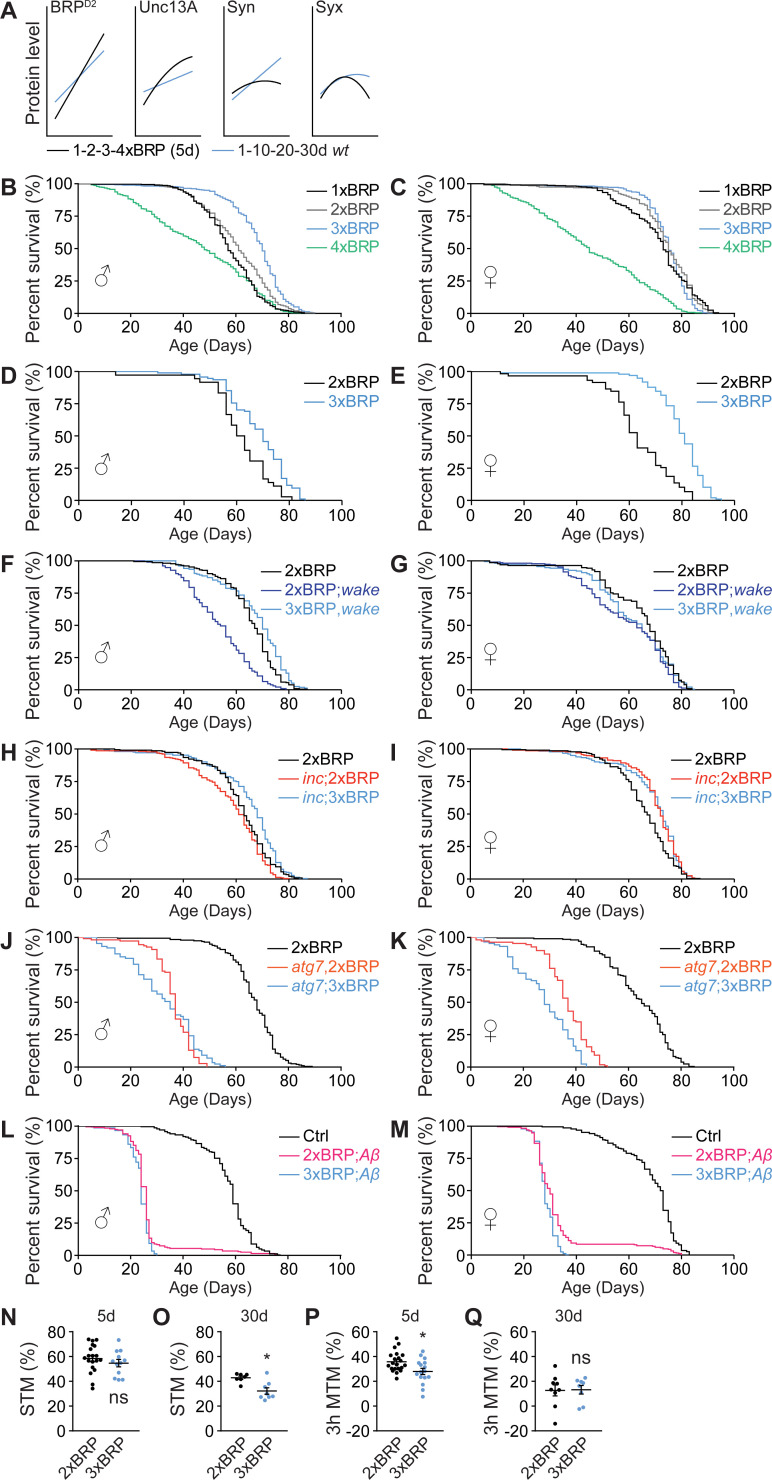
Fig 3. PreScale promotes survival over memory formation during early aging.
(A) Direct curve-fitting comparisons between PreScale during early aging from 1d to 30d (Fig 1) and genetic brp titration from 1xBRP to 4xBRP at age 5d [33]. (B and C) Lifespan analysis of flies with BRP titration from 1xBRP to 4xBRP. For male flies (B), n = 394 for 1xBRP (p < 0.001), n = 396 for 3xBRP (p < 0.001) and n = 395 for 4xBRP (p < 0.001), compared to 2xBRP wt (n = 393). For female flies (C), n = 400 for 1xBRP (p = 0.017), n = 399 for 3xBRP (ns) and n = 397 for 4xBRP (p < 0.001), compared to 2xBRP wt (n = 399). (D and E) An independent experiment of the lifespan of 2xBRP and 3xBRP flies. For male flies (D), n = 94 for 3xBRP compared to 2xBRP wt (n = 36, p < 0.001). For female flies (E), n = 98 for 3xBRP compared to 2xBRP wt (n = 59, p < 0.001). (F and G) Lifespan analysis of flies with 3xBRP in wake mutant background. For male flies (F), n = 234 for 2xBRP;wake compared to 2xBRP wt control (n = 233, p < 0.001) or compared to 3xBRP,wake (n = 155, p < 0.001). For female flies (G), n = 235 for 2xBRP;wake compared to 2xBRP wt control (n = 230, p < 0.001) or compared to 3xBRP,wake (n = 231, ns). (H and I) Lifespan analysis of flies with 3xBRP in inc mutant background. For male flies (H), n = 236 for inc;2xBRP compared to 2xBRP wt (n = 232, p = 0.009) or compared to inc;3xBRP (n = 212, p < 0.001). For female flies (I), n = 235 for inc;2xBRP compared to 2xBRP wt (n = 235, p < 0.001, wt is also shown in Fig 1A) or compared to inc;3xBRP (n = 182, ns). (J and K) Lifespan analysis of flies with 3xBRP in atg7 mutant background. For male flies (J), n = 108 for atg7,2xBRP compared to 2xBRP wt (n = 195, p < 0.001) or compared to atg7;3xBRP (n = 87, ns). For female flies (K), n = 109 for atg7,2xBRP compared to 2xBRP wt (n = 208, p < 0.001) or compared to atg7;3xBRP (n = 87, p < 0.001). (L and M) Lifespan analysis of flies with 3xBRP in Alzheimer’s disease model flies (elav>Aβ). For male flies (L), n = 203 for 2xBRP;Aβ compared to elav>mCD8-GFP control (n = 238, p < 0.001) or compared to 3xBRP;Aβ (n = 151, p = 0.006). For female flies (M), n = 249 for 2xBRP;Aβ compared to elav>mCD8-GFP control (n = 228, p < 0.001) or compared to 3xBRP;Aβ (n = 241, p = 0.002). Gehan–Breslow–Wilcoxon test with Bonferroni correction for multiple comparisons is shown for all longevity experiments. (N and O) STM for 5d (N) and 30d (O) 2xBRP and 3xBRP flies. n = 19 for 5d 2xBRP, n = 12 for 5d 3xBRP. n = 7–8 for 30d for both groups at 30d. (P and Q) MTM tested 3 h after training for 5d (P) and 30d (Q) 2xBRP and 3xBRP flies. n = 21 for 5d 2xBRP, n = 16 for 5d 3xBRP. n = 8–9 for 30d for both groups at 30d. Student t test is shown. *p < 0.05; ns, not significant. Error bars: mean ± SEM. Underlying data can be found in S3 Data. BRP, Bruchpilot; MTM, middle-term memory; STM, short-term memory; wt, wild type.

