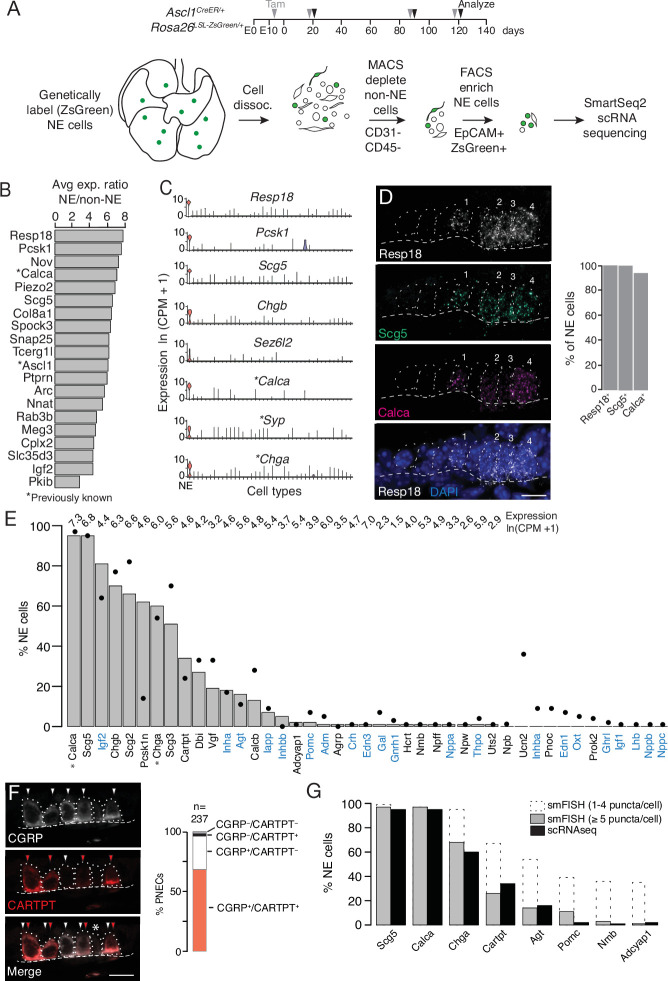
Figure 1. Single cell RNA sequencing of mouse PNECs reveals expression of dozens of peptidergic genes.
(A) Strategy for labeling, enrichment, and scRNA-seq of exceedingly rare PNECs. Timeline (top) of tamoxifen (Tam) injections (gray arrowheads) of Ascl1CreER/+;Rosa26LSL-ZsGreen/+ mice beginning at embryonic day (E) 13 - E14 to permanently induce ZsGreen expression in pulmonary neuroendocrine cells (PNECs or NE cells). Lungs were dissected at indicated ages (black arrowheads, postnatal day (PN) 21, PN90, and PN120) and mechanically and enzymatically dissociated (dissoc.) into single cells. Endothelial (CD31+) and immune (CD45+) cells were depleted by magnetic-cell sorting (MACS) then PNECs enriched by fluorescence-activated cell sorting (FACS) EpCAM+/Zsgreen+ double-positive cells. Sorted cells were analyzed by plate-based scRNA-seq using SmartSeq2 protocol. (B) Most sensitive and specific PNEC markers identified by scRNA-seq, ranked by ratio of the natural logs of the average expression (ln (counts per million, CPM + 1)) of the marker in PNECs (NE cells) vs. non-PNEC (non-NE) lung epithelial cells in mouse lung cell atlas (Travaglini et al., 2020). *, previously known PNEC marker. (C) Violin plots showing expression of five new markers (Resp18, Pcsk1, Scg5, Chgb, Sez6l2) and three previously known markers (*; Calca, Syp, Chga) across 40 cell types from mouse lung cell atlas (Travaglini et al., 2020). From left to right (x-axis): (1) neuroendocrine (NE, PNEC), (2) club, (3) multiciliated, (4) basal, (5) goblet, (6) alveolar type 1, (7) alveolar type 2, (8) glial, (9) smooth muscle, (10) myofibroblast, (11) adventitial fibroblast, (12) alveolar fibroblast, (13) pericyte, (14) mesothelial, (15) chondrocyte, (16) artery, (17) vein, (18) capillary aerocyte, (19) capillary-general, (20) lymphatic, (21) B cells, (22) Zbtb32+ Bcells, (23) plasma, (24) CD8+ T, (25) CD4+ T, (26) regulatory T, (27) Ly6g5bt + T, (28) natural killer, (29) Alox5+ lymphocyte, (30) neutrophil, (31) basophil, (32) alveolar macrophage, (33) interstitial macrophage, (34) plasmacytoid dendritic, (35) myeloid dendritic type 1, (36) myeloid dendritic type 2, (37) Ccr7+ dendritic, (38) classic monocyte, (39) nonclassical monocyte, (40) intermediate monocyte. (D) Close-up of neuroepithelial body (NEB) in PN155 wild type (C57BL/6NJ) mouse lung probed by multiplex single molecule RNA fluorescence in situ hybridization (smFISH) to detect expression of indicated PNEC markers, with DAPI nuclear counterstain. Dashed circles, individual PNECs (numbered); dashed line (basement membrane). Scale bar, 10 μm. Quantification (right) of clustered PNECs that express indicated markers (n=76 cells scored in left lobe and right lower lobe). Note classic marker Calca (CGRP) was not detected in 6% of Resp18+Scg5+double-positive PNECs. (E) Quantification of peptidergic gene expression in PNECs by scRNA-seq. Bars show percent of profiled PNECs (NE cells, n=176) with detected expression of the 43 peptidergic genes indicated; values above bars are log-transformed mean gene expression (ln (CPM + 1)) among expressing cells. Black dots, expression values from a second PNEC dataset (filled circles, n=92 PNECs) in which PNECs were genetically labeled using CgrpCreER;Rosa26LSL-ZsGreen mice, sorted, and isolated on a microfluidic platform (Ouadah et al., 2019). (Comparison by Fisher’s exact test (two-tailed) of the proportions of PNECs detected in the two scRNA-seq datasets is provided in Supplementary file 4, with caveat that the comparison is of results from different techniques on different samples.) *, Previously known mouse PNEC peptidergic genes; blue highlight, classic hormone genes. (F) Micrograph of NEB from PN90 Ascl1CreER/+;Rosa26LSL-ZsGreen/+ mouse lung immunostained for CGRP and newly identified PNEC neuropeptide CARTPT. White arrowheads, CGRP+ PNECs; red arrowheads, CARTPT+ PNECs; *, CGRP- CARTPT- double-negative PNEC. Right panel, quantification of CGRP and CARTPT staining in PNECs defined by Ascl1-CreER-lineage label (n=237 PNECs scored in three PN60 Ascl1CreER/+;Rosa26LSL-ZsGreen/+ mice). (G) Quantification of PNEC (NE cell) expression of the indicated peptidergic genes by scRNA-seq (black bars, n=176 cells) and multiplex smFISH (grey bars and dashed extensions, n=100cells scored in NEBs from 2 mice, see Figure 2). Grey bars, cells with high expression (>5 puncta/cell); dashed extensions, cells with low expression (1–4 puncta/cell). Fisher’s exact test (two-tailed) gave p=1 (not significant) for all comparisons of proportions of expressing PNECs for each gene as detected by smFISH (>5 puncta/cell) vs. scRNA-seq (black bars); when the comparisons included cells with 1–4 puncta/cell by smFISH, differences were significant (p<0.05) for Chga, Cartpt, Agt, Pomc, Nmb, and Adcyap1 but not for Scg5 and Calca (p=0.9 for both).


