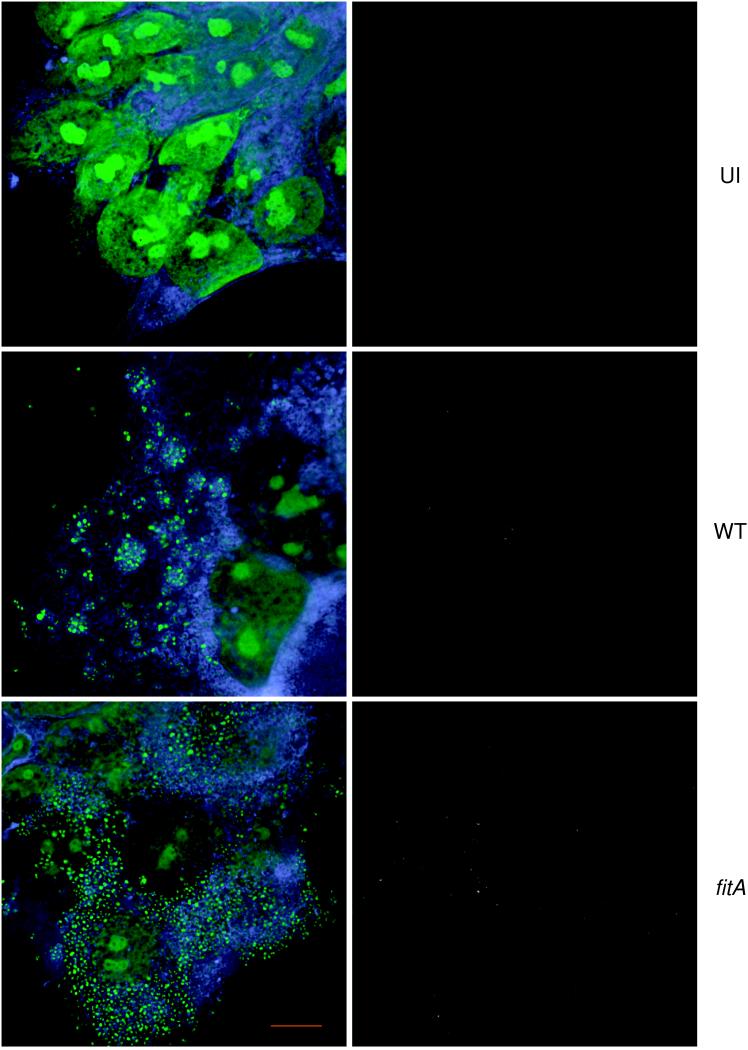
FIG. 4.
Fluorescence microscopy of T84 monolayers. T84 cells were infected with WT MS11A (WT) or the MS11A fitA mutant (fitA) or left uninfected (UI). The cultures were fixed with formaldehyde and stained with a polyclonal anti-GC antibody to visualize extracellular bacteria. They were then permeabilized and stained with TMA-DPH to visualize total cellular membranes and with PI to visualize bacterial DNA and the nucleus. Left panels, T84 cells visualized for membranes (blue) and nucleic acids (green); right panels, the same field of cells visualized for adhered bacteria (grey). Samples were imaged using the DeltaVision Restoration Microscopy System, courtesy of Applied Precision, Inc. Magnification, ×1,800. Scale bar (red), 10 μm.

