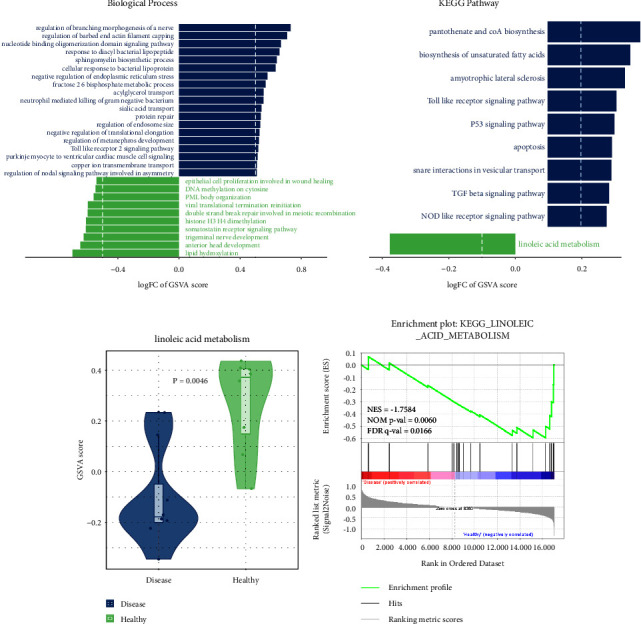
Figure 1.

Gene set enrichment analysis. (a) Differentially expressed BPs in the disease group and the healthy group. (b) Differentially expressed pathways in the disease group and the healthy group. (c) Comparison of the GSVA enrichment score of the linoleic acid metabolism pathway between the disease group and the healthy group. (d) GSEA result of the linoleic acid metabolism pathway in the disease group and the healthy group.
