
Figure 1.
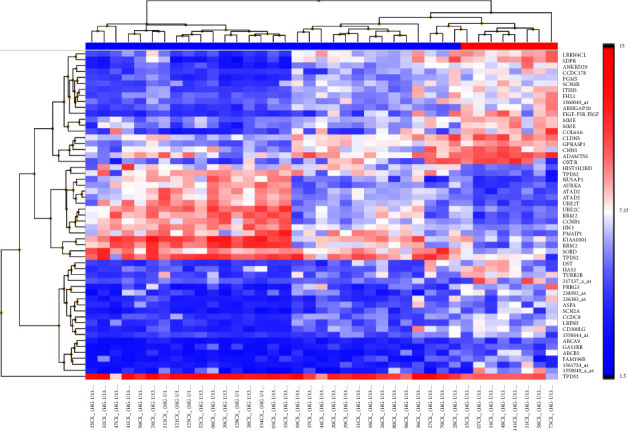
Unsupervised clustering of gene expression data in SS samples: pCR (n = 8) vs. non-pCR (n = 31). In the top row, pCR samples are denoted by the red header, and the blue title indicates non-pCR samples. The heatmap shows one sample for each column and one gene or probe for each horizontal line. The color indicates gene expression value intensities, where the gradient pink-red represents overexpression, and the gradient light blue-dark blue represents underexpression.