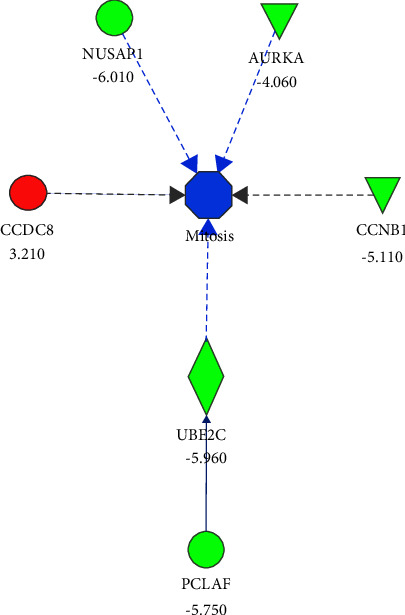
Figure 3.

Molecule activity prediction of the mitosis biofunction using differentially expressed genes identified in the contrast pCR vs. non-pCR from SS samples. Colors indicated the predicted relationship between gene expression levels and biofunctions. Green: down-regulated genes; red: up-regulated genes. Blue: bio-function inhibited. The blue line leads to inhibition; the gray line indicates an effect not predicted. The fold change of every differentially expressed gene appears below from its gene symbol.
