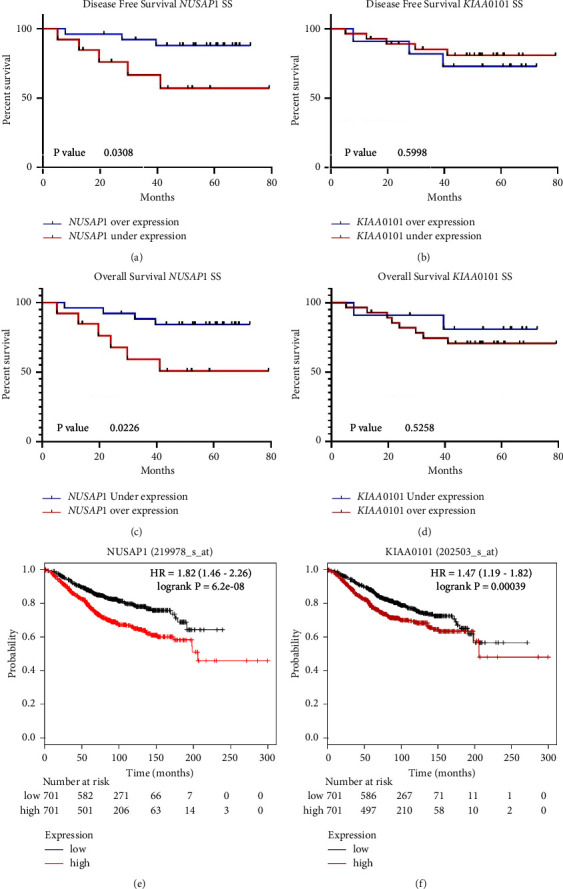
Figure 5.

Disease-free survival and overall survival against NUSAP1 and PCLAF/KIAA0101 gene expression profiles in surgical samples (SS). (a-b) DFS curves considering NUSAP1 and PCLAF/KIAA0101 gene expression profiles after NCT (SS), respectively. Blue lines, underexpression; red lines, overexpression. (c-d) OS curves considering NUSAP1 and PCLAF/KIAA0101 gene expression profiles after NCT (SS), respectively. Blue lines, underexpression; red lines, overexpression. (e-f) OS curves considering NUSAP1 and PCLAF/KIAA0101 expression profiles from the Kaplan–Meier plotter website (https://kmplot.com), respectively. Black lines, underexpression; red lines, overexpression.
