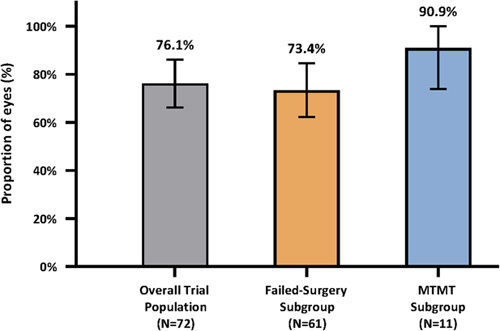
FIGURE 2.

Responder effectiveness endpoint: proportion of responders at month 12. Data from intent-to-treat population in all groups. Multiple imputation was used for 1 patient with missing data at month 12. Responders: patients with ≥20% reduction in mean diurnal intraocular pressure at month 12 versus baseline on the same or fewer ocular hypotensive medication classes as baseline were responders; Nonresponders: patients with (1) hypotony (intraocular pressure <6 mm Hg) associated with clinically significant findings, (2) loss of light perception, (3) intraocular pressure -related SSIs, (4) cyclodialysis cleft, and/or (5) no stents visible were treated as nonresponders. Vertical lines represent 95% CI. MTMT indicates maximum tolerated medical therapy.
