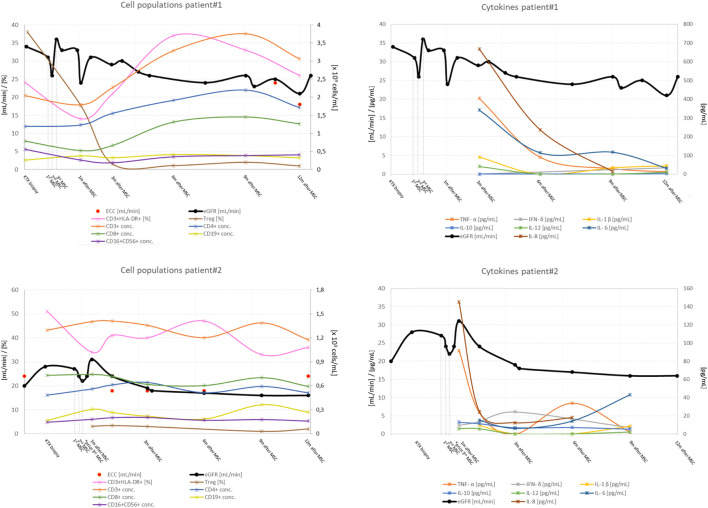
FIGURE 3.
Kidney graft function, peripheral blood lymphocyte populations and serum concentration of cytokines before and after application of MSCs in patient #1 and patient #2. Legend: eGFR, estimated glomerular filtration rate; conc, concentration; Treg, CD4+CD25++ T cells (this subset contains a proportion of Tregs cells). Cytokine concentrations after mesenchymal stem cells application (in U/ml for soluble interleukin 2 receptor and in pg/ml for other cytokines); TNF, tumor necrosis factor; IL, interleukin; s-IL-2-R, soluble interleukin 2 receptor; IFN, interferon, *patient#2 received only two doses of MSCs.

