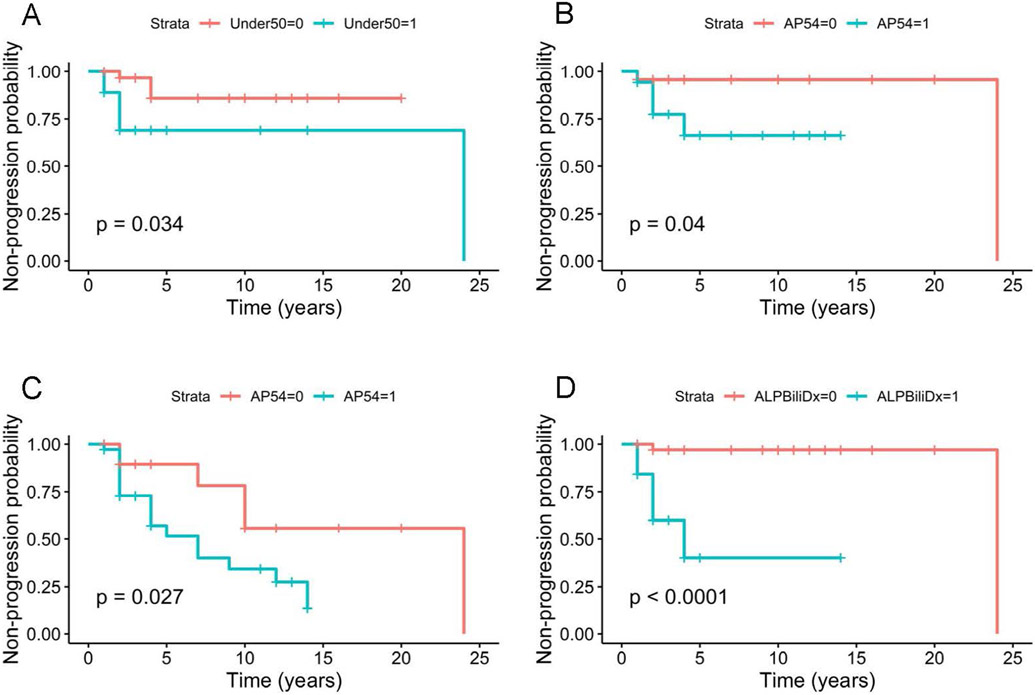
Figure 2.
Kaplan Meier analysis of progression of ductopenia. (A) Progression to severe ductopenia (<25%) stratified by initial ductopenia score 0 or 1 (>50% bile ducts) in red and initial ductopenia score 2+ (25 to 50%) in blue, (B) progression to severe ductopenia stratified by baseline elevated baseline APRI in blue, (C) overall decrease in bile duct count from first biopsy on final biopsy stratified by baseline elevated APRI in blue and (D) progression to severe ductopenia with baseline ALP > 2 times the upper limit of normal with an elevated bilirubin in blue. P value log rank score.

