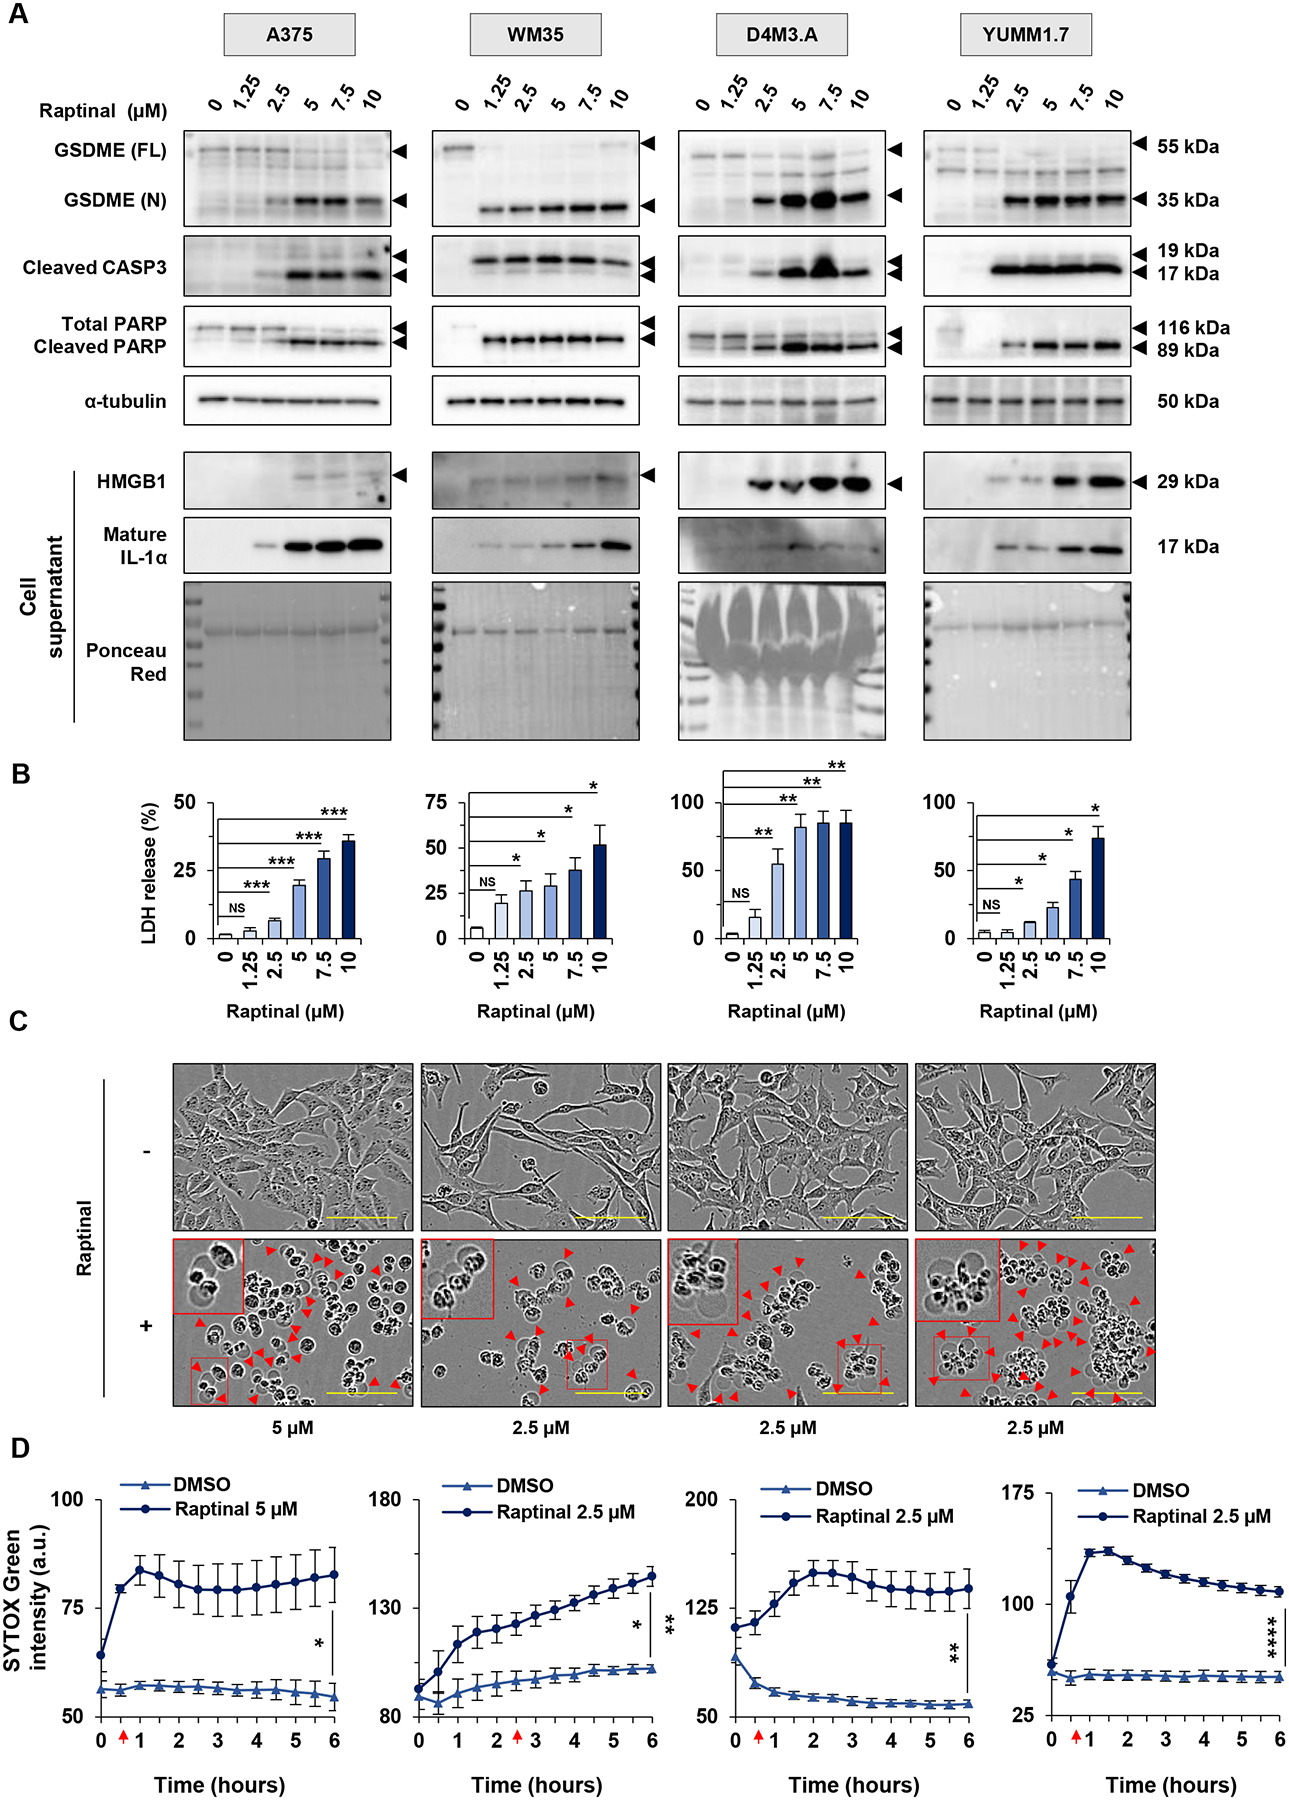
Figure 1: Raptinal induces pyroptosis in human and mouse melanoma cells.

(A-B) Human melanoma cells (A375 and WM35) and mouse melanoma cells (D4M3.A and YUMM1.7), were treated in vitro for 3 hours with doses of raptinal ranging from 1.25 to 10 μM. DMSO was used as a vehicle control. (A) Levels of GSDME, cleaved caspase-3 and PARP in lysates, or HMGB1 and IL-1α in supernatants after raptinal treatment. α-tubulin or ponceau red staining are controls for protein lysates or supernatant total protein extracts, respectively. Full-length GSDME (FL) runs at 55 kDa and cleaved N-terminal GSDME (N) runs at 35 kDa. Total PARP runs at 116 kDa and cleaved PARP runs at 89 kDa. Western Blots shown are representative of at least three independent experiments. (B) Percentage of LDH release averaged from at least three independent experiments. Error bars are SEM. Significance was assessed by Student t test for WM35 and YUMM1.7 cells and by Mann-Whitney test for A375 and D4M3.A cells, NS: non-significant, *p<0.05, **p<0.01, ***p<0.001. (C-D) Cells were treated with 2.5 μM raptinal, except for A375 that were treated with 5 μM. (C) Cell morphology visualized with the IncuCyte S3 system at x10 objective. Plasma membrane bubble-like protrusions, a characteristic feature of pyroptosis, are indicated by red arrow and a magnification is show in the red frame. Scale bar: 100 μm. Cell morphology images shown are representative of at least three independent experiments. (D) SYTOX green fluorescence was measured over time with IncuCyte S3 system and normalized to cell confluence at each timepoint for cells treated with DMSO or raptinal. At least two replicate wells were performed in each experimental condition and all experiments were performed at least three times independently. Data are representative of at least three independent experiments. Error bars are SEM. Significance was assessed by Student t test, *p<0.05, **p<0.01, ***p<0.001, ****p<0.0001. Red arrows indicate the time when the treated cells were significantly more fluorescent than untreated cells.
