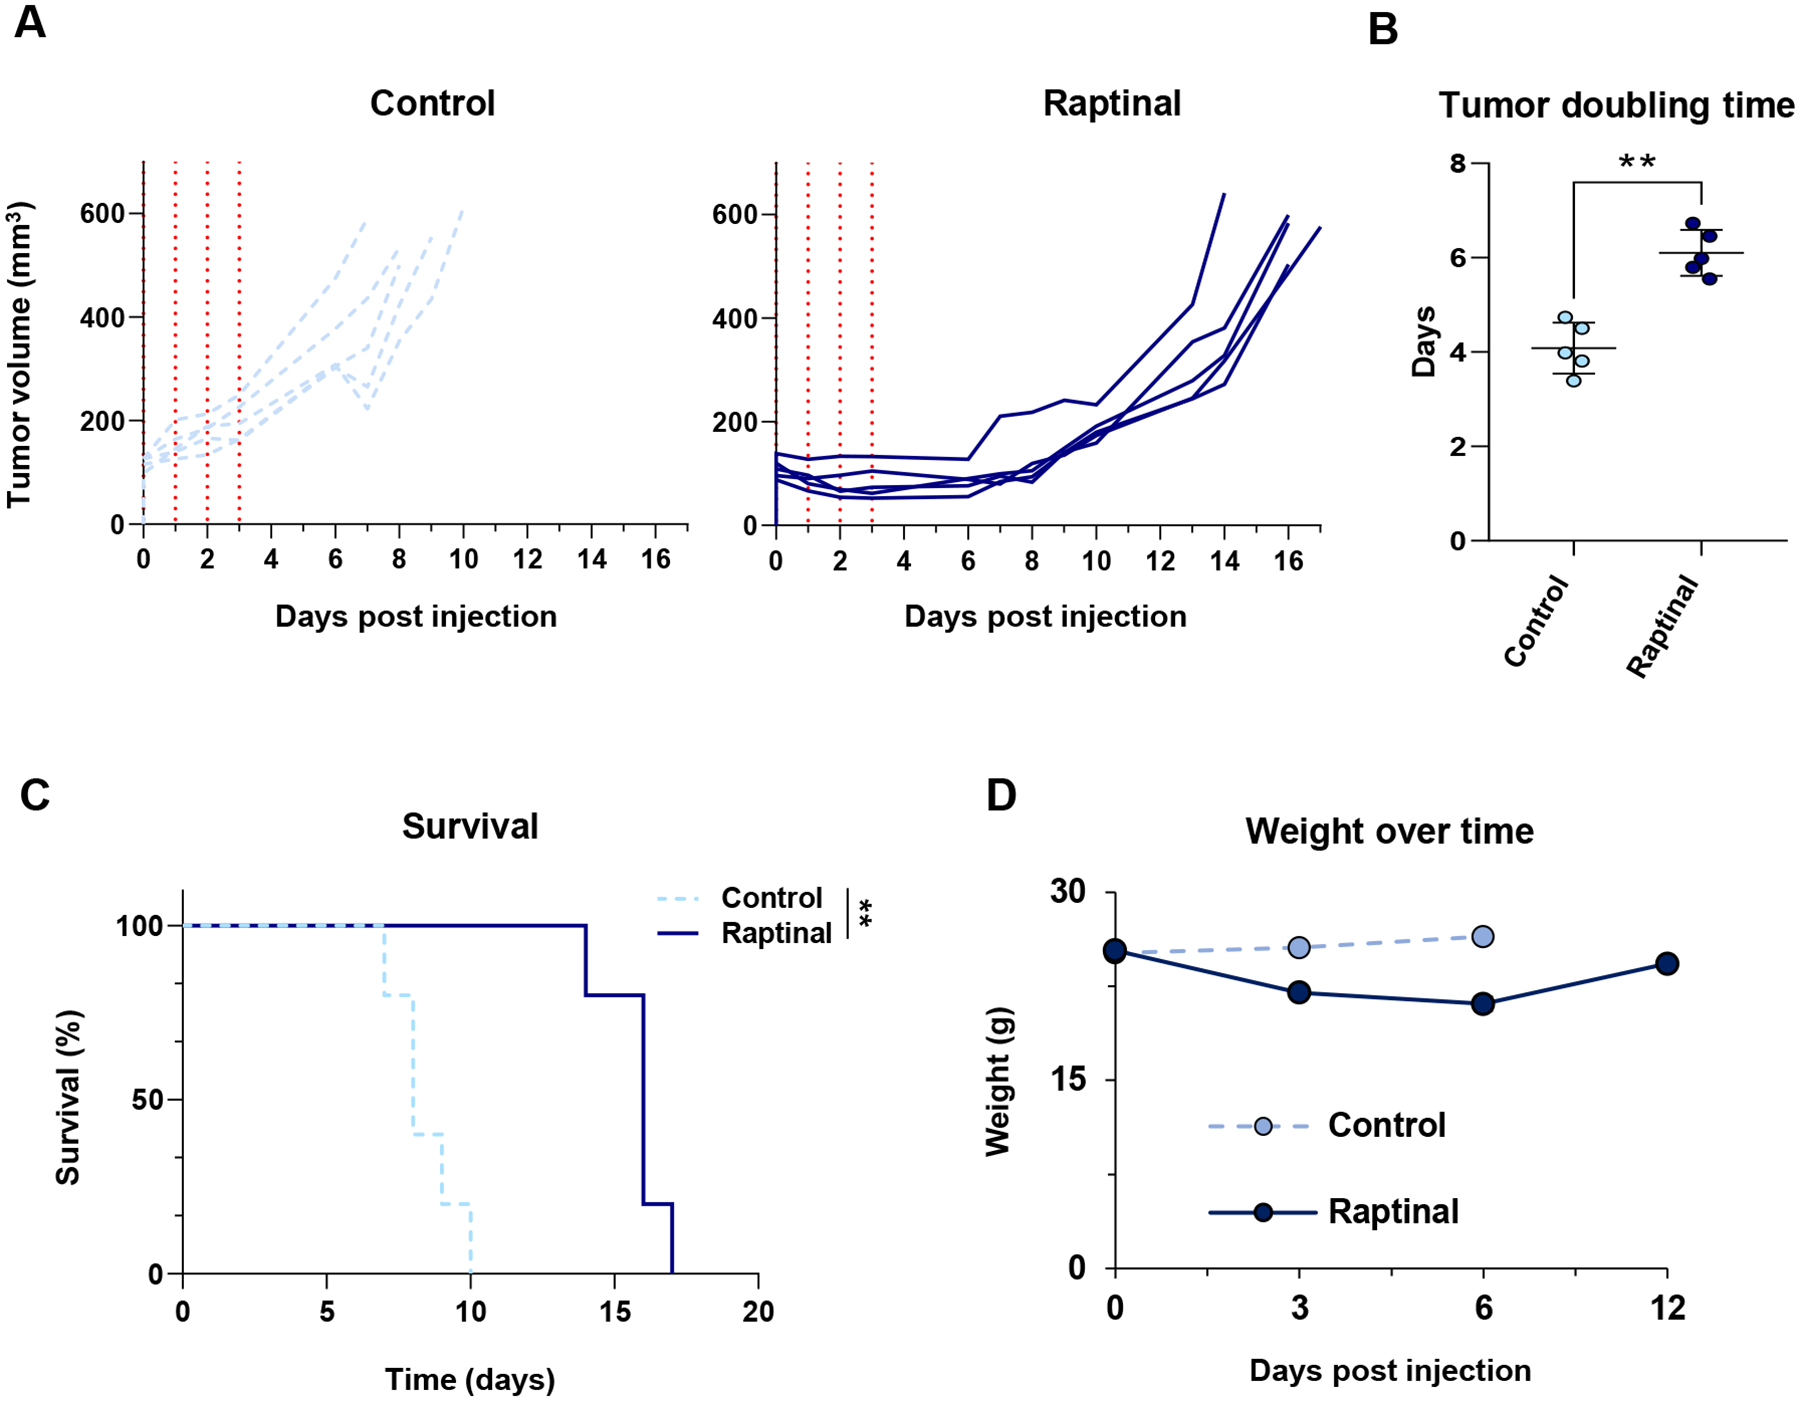
Figure 2: Raptinal delays tumor growth in vivo.

YUMM1.7 cells were implanted intradermally into C57BL/6J animals and allowed to grow to approximately 100 mm3. (A) Tracings of each tumor treated for four days with vehicle control (n=5) (light blue) or raptinal (n=5) (dark blue) are shown to the endpoint of 500 mm3. The vertical red dotted lines correspond to the days in which mice received injections. (B) Tumor growth was modeled as a function of time to assess average tumor doubling time from day 0 to the 500 mm3 endpoint. Each individual data point represents one animal used with the average and standard deviation displayed. Significance was assessed using the Mann-Whitney test, **p<0.01. (C) Kaplan-Meier survival curves comparing vehicle control to the raptinal group. A log rank (Mantel-Cox) test was used to determine significance, **p<0.01. (D) Mouse weights over time from the vehicle control and raptinal treatment arms.
