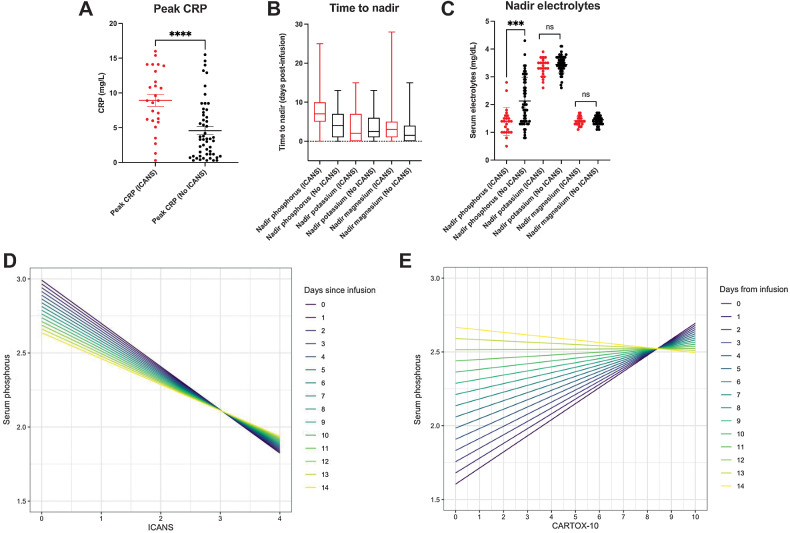
Figure 3.
Nadir serum phosphorus values and peak CRP values differ in patients who developed ICANS, and the severity of neurotoxicity is correlated with serum phosphorus within hypophosphatemic range, the strength of which depends on time from CAR T-cell infusion. A, Peak CRP values measured throughout admission in patients receiving CAR T-cell therapy who developed ICANS compared with those who did not (***, P < 0.0001; unpaired t test) represented as mean ± SEM. B, Time to nadir measured from days post CAR T-cell infusion represented as a box and whisker plot showing mean and range. C, Nadir serum phosphorus, potassium, and magnesium values measured throughout admission in patients receiving CAR T-cell therapy who developed ICANS compared with those who did not (***, P < 0.0001; unpaired t test) represented as mean ± SEM. D, Linear mixed-effects model with phosphorus as the outcome variable, and time from CAR T-cell infusion, as well as either ICANS or (E) CARTOX-10 as the fixed effect of the model. ICANS grades neurotoxicity from 1 to 4 with increasing severity of symptoms (with highest severity being 4), while a CARTOX-10 grades neurotoxicity from 1 to 10 with decreasing severity of symptoms (with lowest severity a 10). The color-coded lines represent the relationship between serum phosphorus and ICANS grade or CARTOX-10 as a function of time post-infusion.

