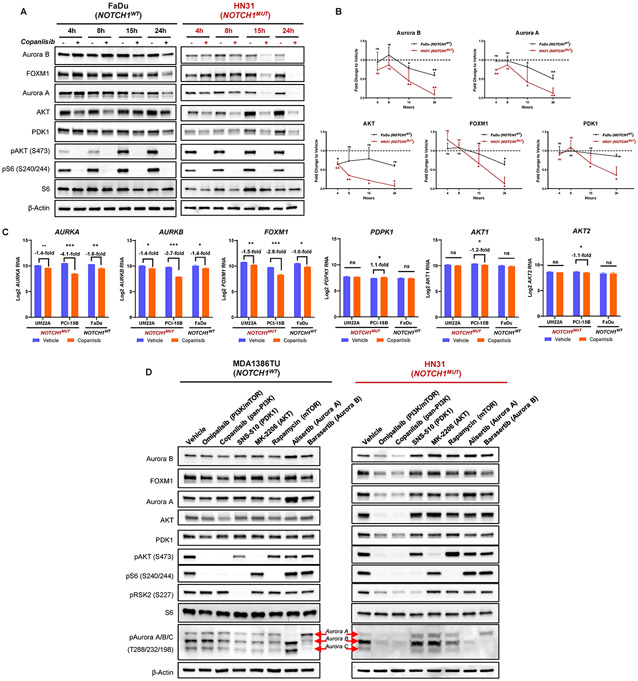
Fig. 2. PI3K inhibition results in considerable proteomic alterations selectively in NOTCH1 mutant (NOTCH1MUT) head and neck squamous cell carcinoma (HNSCC).
(A) Representative Western blot analysis images of NOTCH1WT and NOTCH1MUT HNSCC cell lines at indicated time points after treatment with 200nM copanlisib (h, hours). (B) Quantification of the Western blot images shown in (A) from at least two independent experiments (mean ± SD); ns, nonsignificant, *P < 0.05, **P < 0.01, two-sample t test. (C) Graphs showing mRNA levels measured by RNA sequencing of indicated genes in NOTCH1MUT (UMSCC22A, PCI-15B) and NOTCH1WT (FaDu) cell lines after treatment with 200nM copanlisib at 18 hours. Data are presented as the mean ± SD of at least three independent experiments; *P < 0.05, **P < 0.01, ***P < 0.001, ns, nonsignificant, multiple t-tests with Benjamini-Hochberg correction. (D) Western blot analysis of protein changes in NOTCH1WT and NOTCH1MUT HNSCC cell lines after treatment with indicated drugs (50nM omipalisib, 50nM barasertib, 200nM copanlisib, 200nM alisertib, 250nM rapamycin, 300nM SNS-510, 400nM MK-2206) for 24 hours.

