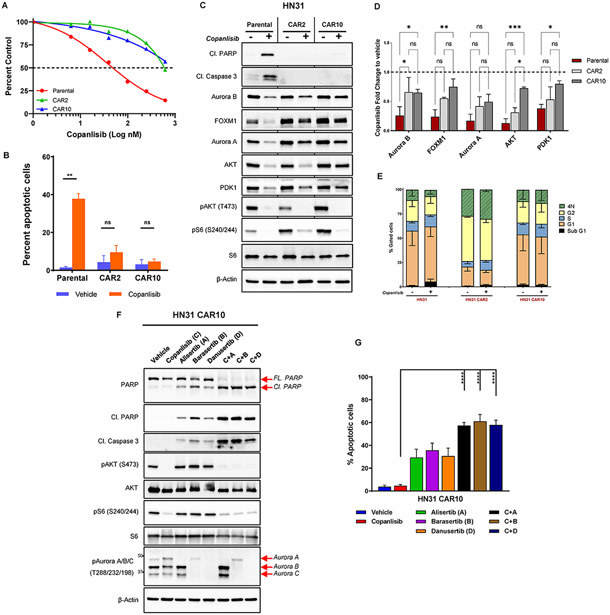
Fig. 4. Aurora kinases mediate acquired resistance to PI3K inhibition in NOTCH1 mutant (NOTCH1MUT) head and neck squamous cell carcinoma.
(A) HN31 parental and copanlisib acquired resistant (CAR) cells were treated with increasing concentrations of copanlisib for 72 hours, and cell viability was measured with the CellTiter-Glo assay. CAR2 and CAR10 represent two different clones of resistant cells, and the dotted line denotes 50% cell population. (B) Apoptotic cells measured by FITC-dUTP/propidium iodide (PI) staining in HN31 parental and CAR cells treated with 200nM copanlisib for 48 hours. The values indicate mean ± SD from three independent experiments: **P < 0.01, ns, nonsignificant, two-tailed Student t test. (C) Western blot analysis of HN31 parental and CAR cells upon treatment with 200nM copanlisib for 24 hours. (D) Quantification of protein expression from the Western blot analysis shown in (C) using Image J and normalized using β-Actin as a control; subsequent fold change to vehicle was calculated. Bars indicate mean ± SD of two biological replicates; *P < 0.05, **P < 0.01, two-way analysis of variance corrected for multiple comparisons with the Tukey test. (E) Cell cycle analysis of HN31 parental and CAR cells treated with 200nM copanlisib for 48 hours measured from PI staining as mean ± SD of three independent experiments. (F) Western blot analysis of HN31 CAR10 cells treated with indicated drugs (200nM copanlisib, 200nM alisertib, 50nM barasertib, 500nM danusertib) either as single agent or in combination for 24 hours. FL, full length; Cl, cleaved. (G) Percentage of apoptotic cells measured from Annexin V/PI staining in HN31 CAR10 cells upon treatment with indicated drugs (200nM copanlisib, 200nM alisertib, 50nM barasertib, 500nM danusertib) for 24 hours. The percentage of apoptotic cells is expressed as the mean ± SD from three independent experiments; ***P < 0.001, ****P < 0.0001, one-way analysis of variance corrected for multiple comparisons with the Tukey test.

