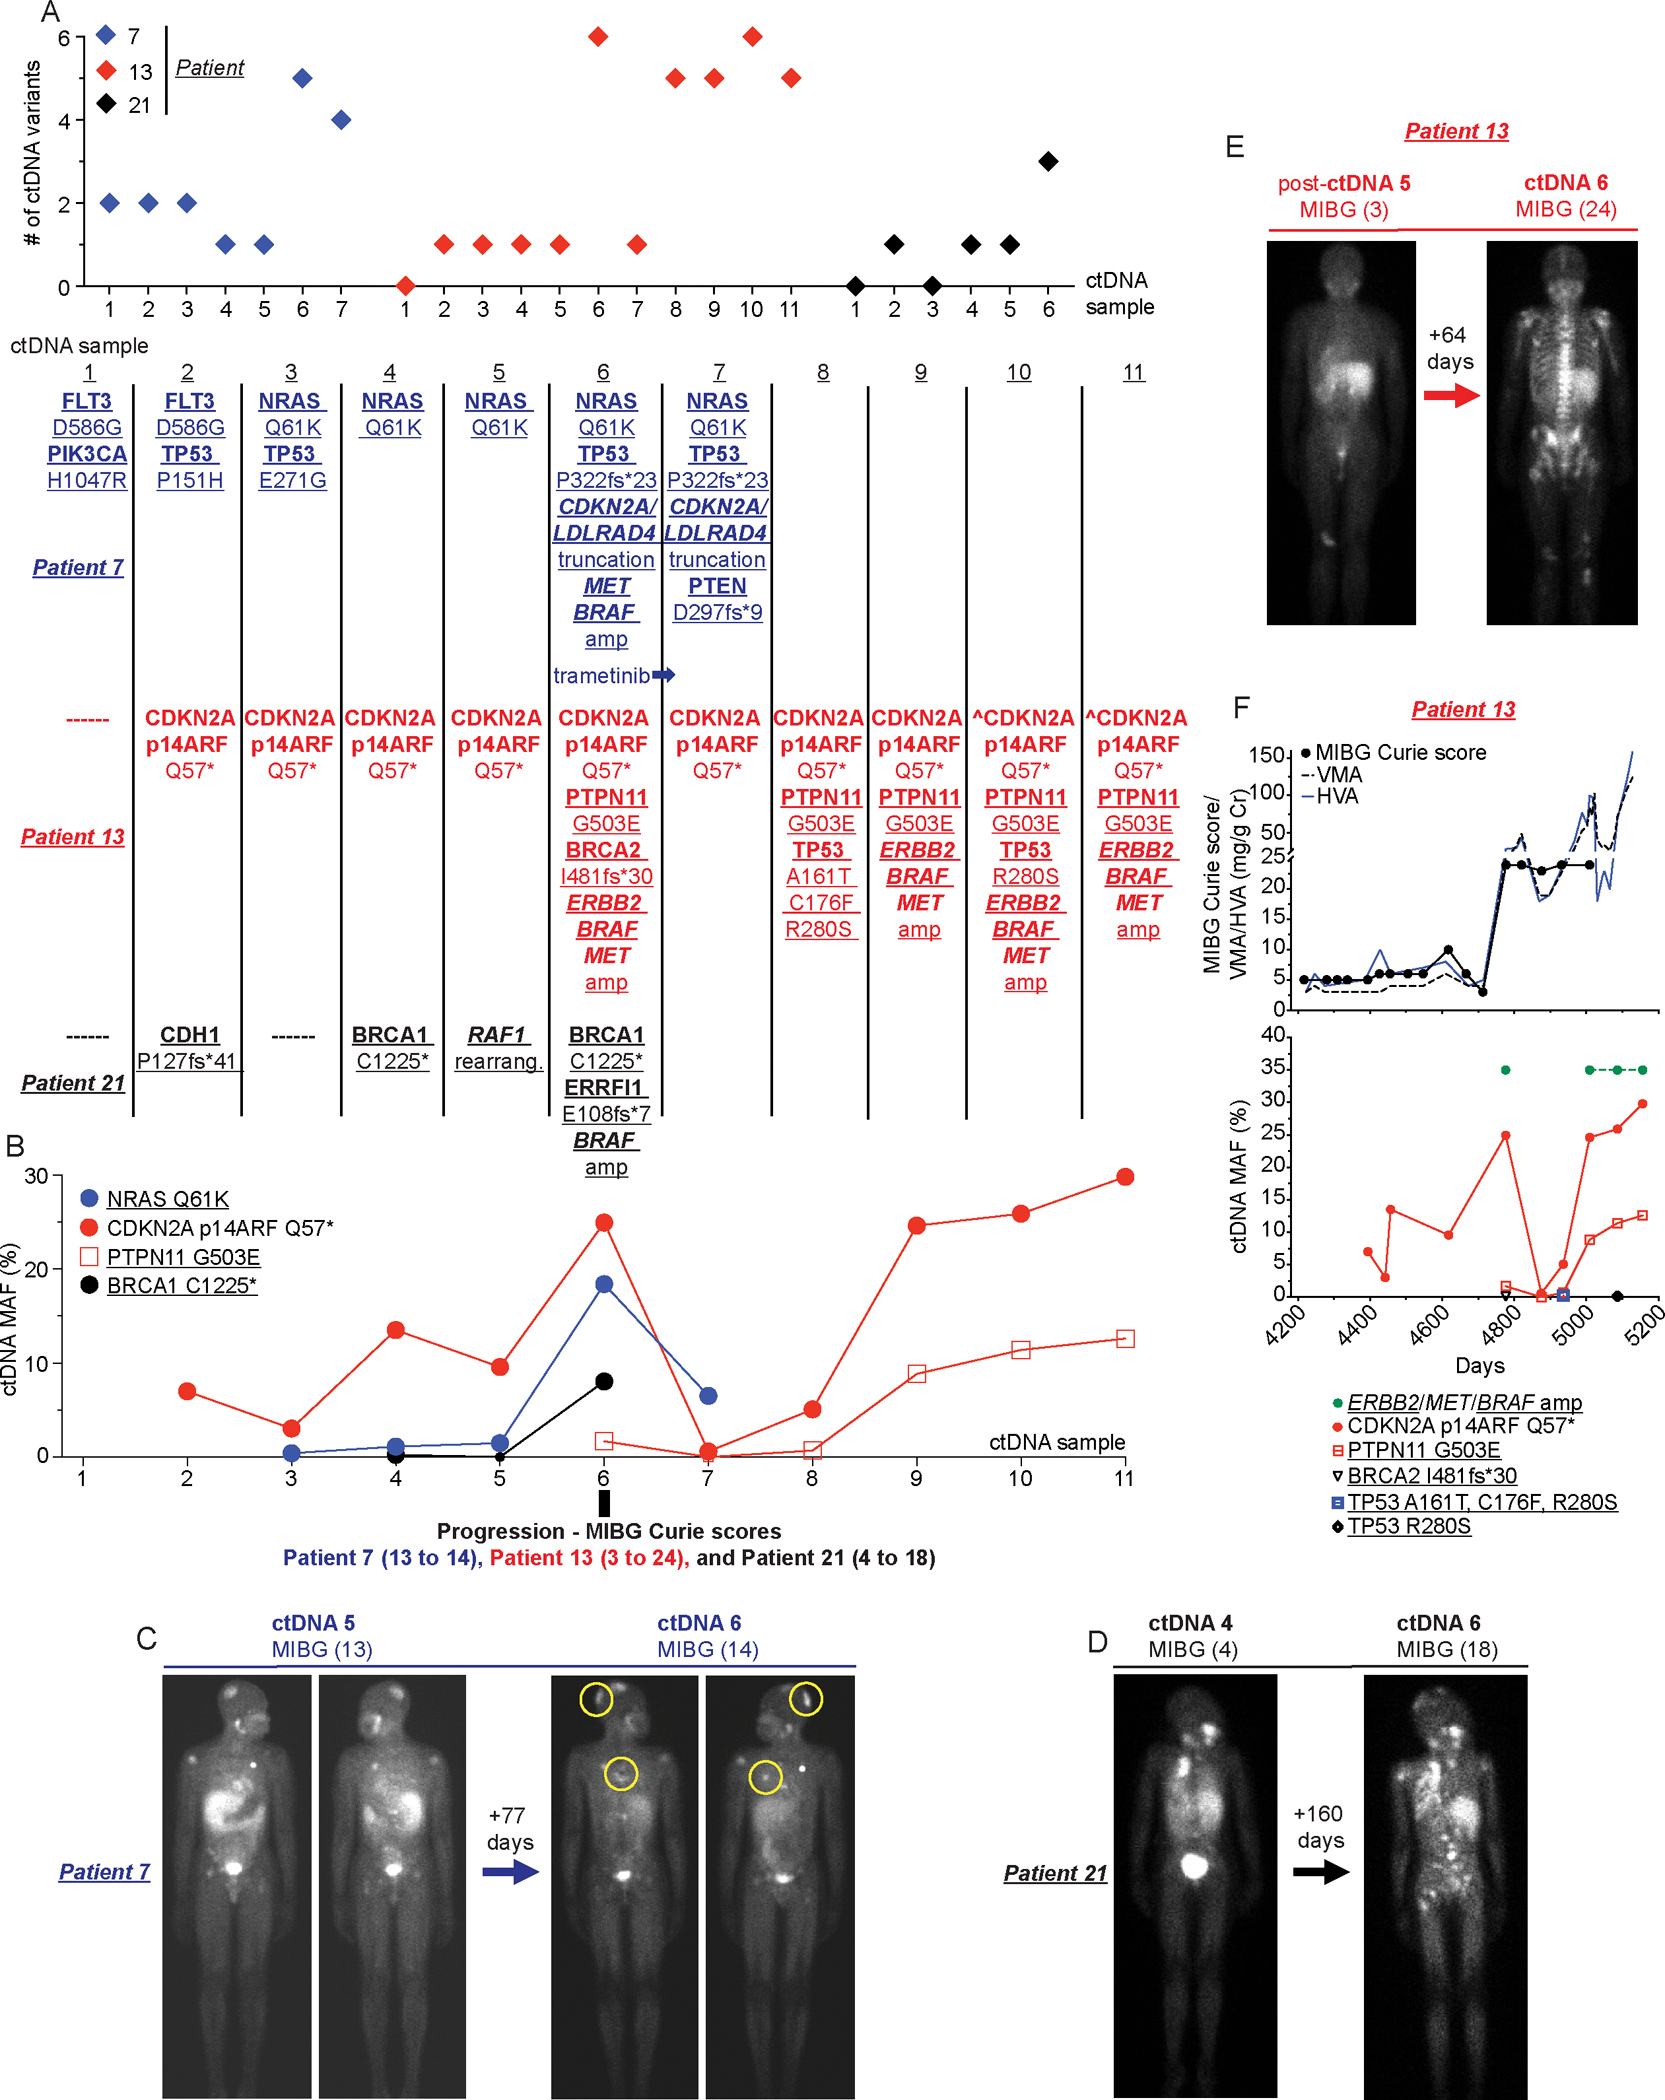
Figure 5. ctDNA evolution correlates with disease progression in neuroblastoma patients.

(A) Plot of total number of ctDNA variants identified in serial samples collected from patients 7,13, and 21 (top) with evolution of specific ctDNA variants shown (bottom).
(B) Plot of MAFs for recurrent ctDNA variants summarized in A.
(C-E) Paired 123I-MIBG scans with associated Curie scores for patient 7 (C; new disease noted in yellow circles in right image), patient 21 (D), and patient 13 (E) at the time of rising ctDNA MAFs and increasing ctDNA complexity (ctDNA sample 6 in B as noted).
(F) Serial ctDNA and disease evaluation correlation plot for patient 13 showing relationship between 123I-MIBG Curie scores and urine VMA/HVA levels (top) and ctDNA data (bottom).
Underlined variants denote those unique to ctDNA and (^) denotes ctDNA profiling done as part of clinical care.
