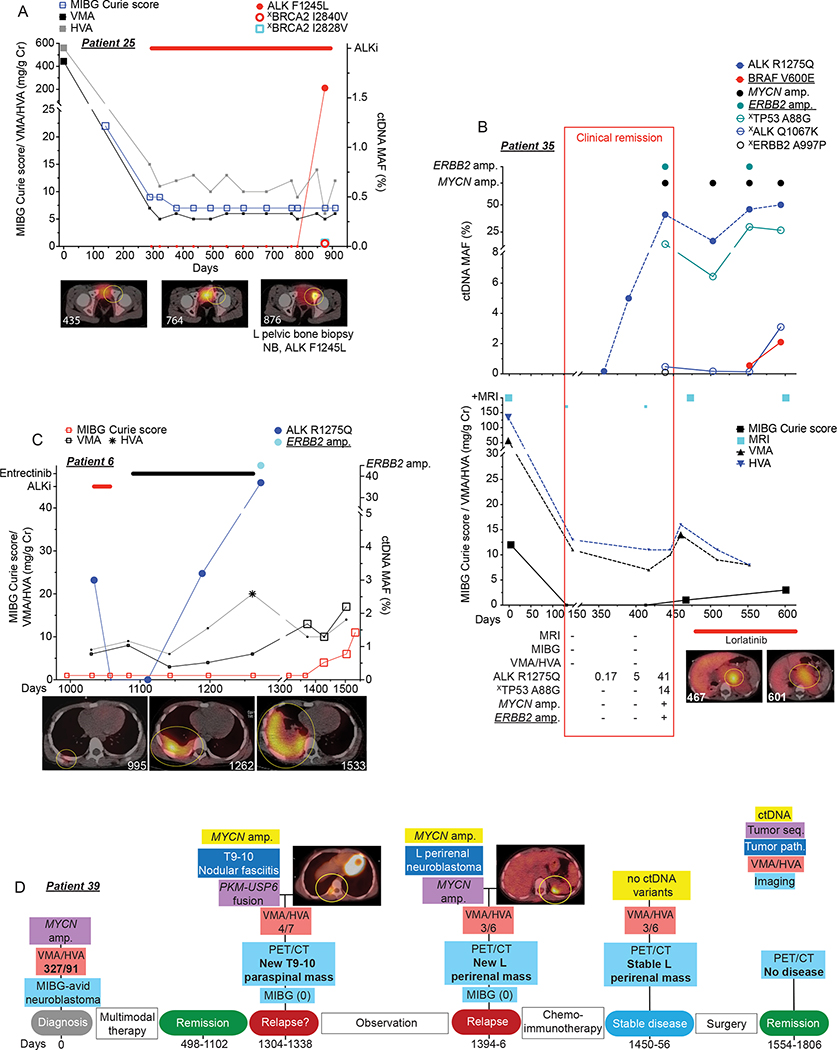
Figure 6. Serial sequencing of ctDNA from neuroblastoma patients can provide enhanced disease surveillance.
(A) Serial ctDNA and clinical disease evaluation correlation plot for patient 25 showing relationship between ctDNA data, 123I-MIBG Curie scores, and urine VMA/HVA levels (top) and representative axial 123I-MIBG images (bottom, 123I-MIBG scan day noted in bottom left).
(B) Serial ctDNA and clinical disease evaluation correlation plot for patient 35 showing relationship between ctDNA data (top) and MRIs, 123I-MIBG Curie scores, urine VMA/HVA levels, and representative axial 123I-MIBG images at the indicated time points (bottom, 123I-MIBG scan day noted in bottom left of image). Clinical remission time frame denoted with red box with ctDNA MAFs and imaging summary during clinical remission noted in bottom table.
(C) Serial ctDNA and clinical disease evaluation correlation plot for patient 6 showing relationship between ctDNA data, 123I-MIBG Curie scores, and urine VMA/HVA levels (top) and representative axial 123I-MIBG images at the indicated time points (bottom, 123I-MIBG scan day noted in bottom right of image).
(D) Serial ctDNA and clinical disease evaluation timeline for patient 39 showing relationship between ctDNA and tumor sequencing data, PET/CT, 123I-MIBG Curie scores, and urine VMA/HVA levels with representative axial PET/CT images at the indicated time points.
Large symbols in plots represent abnormal values and small symbols represent normal values.
Amp, amplification; seq, sequencing. Chemoimmunotherapy, Irinotecan/temozolomide/GD2-targeting chimeric monoclonal antibody dinutuximab, a treatment regimen used commonly for relapsed neuroblastoma.
Underlined variants denote those unique to ctDNA and (X) denotes variants of unknown significance.

