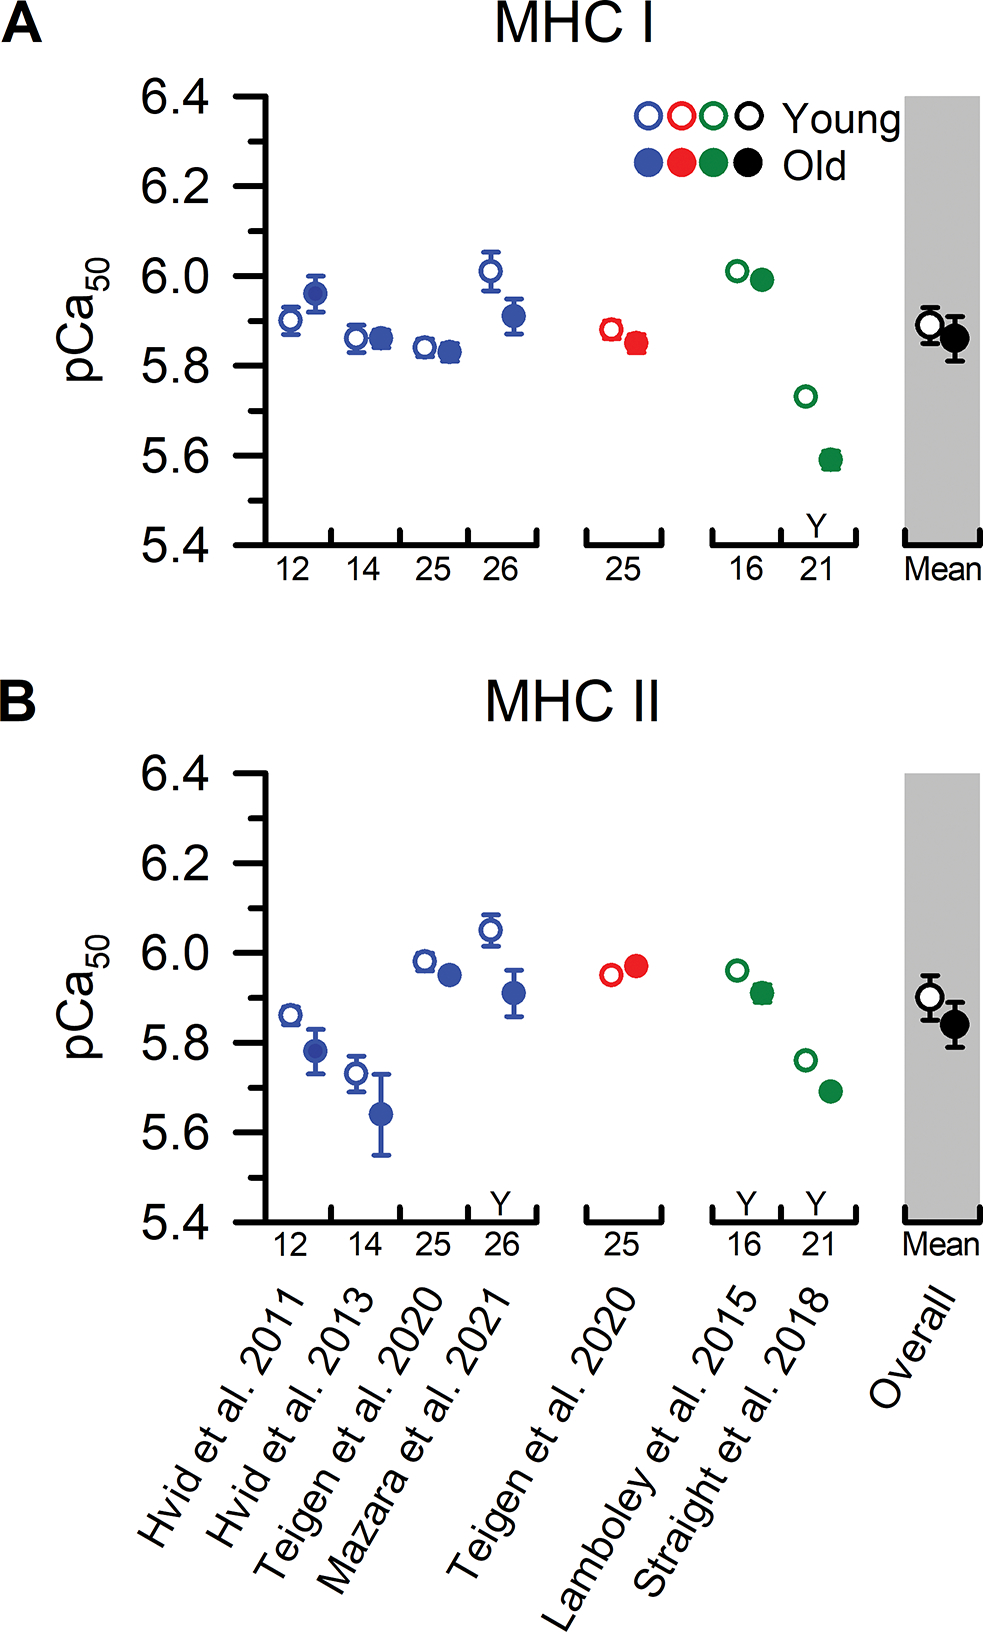
Figure 6. MHC I and MHC II fibre pCa50 from younger and older adults.

Individual study data and collective means for calcium sensitivity (pCa50) of (A) MHC I and (B) MHC II fibres. Symbols represent the means from men (blue), women (red), and when the sexes were combined (green). The collective means (shaded grey regions) for all studies combined (black symbols) were calculated by pooling the results from all the studies. Due to the limited number of studies comparing pCa50 in single fibres from younger and older adults, statistical analysis was conducted using an unpaired t-test with only the sexes combined (overall). To evaluate whether differences in the sample sizes between studies influenced the pooled results, the collective means were also compared between age groups using a weighted linear regression. None of the conclusions differed between the analyses, and thus, we report the collective means and p-values based on the unweighted analyses. For ease of identifying the data from each study both within and between figures, all studies were arranged in chronological order and assigned a numerical value that is located beneath the x-axes. Data shown from individual studies were restricted to MHC IIa fibres if the MHC IIx and hybrid IIa/IIx were also reported; otherwise, the data represent the MHC II fibres which include a mixture of MHC IIa, hybrid IIa/IIx, and IIx isoforms. Statistical significance (P < 0.05) was extracted from the results of the individual studies. Y = Young > Old. O = Old > Young. Values are the mean ± SE.
