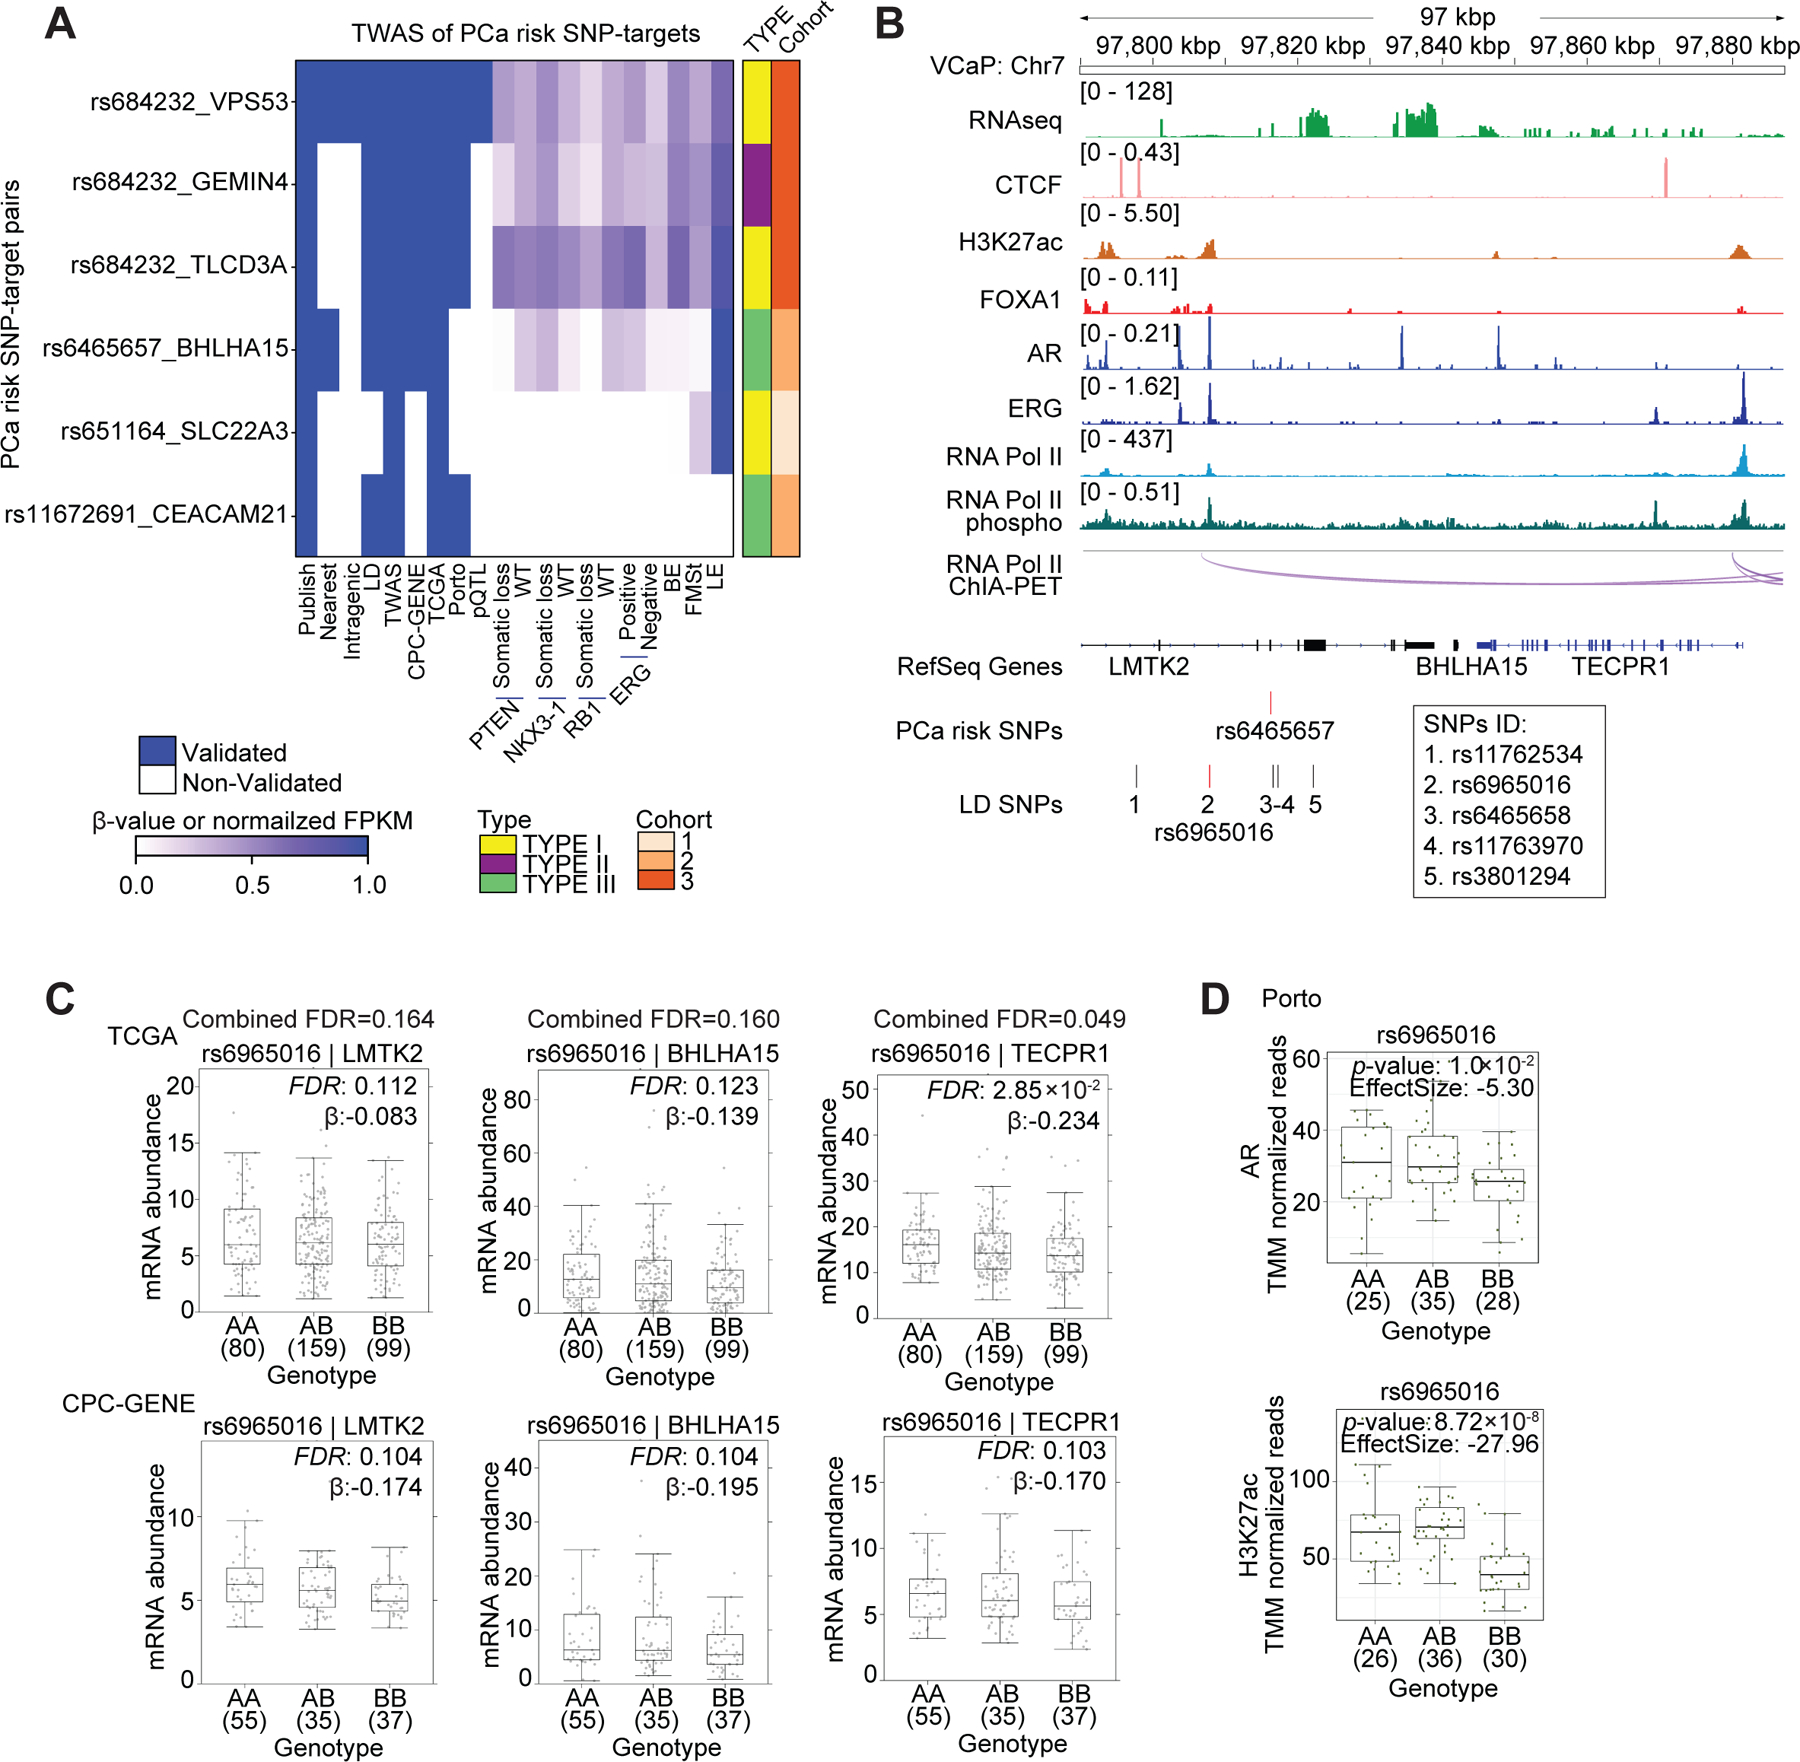
Figure 6. Transcriptional regulation of TWAS hits.

(A) Summary of SNP-TWAS target gene pairs rediscovered by the 3D genomics approach. Each row represents a SNP-target pair, and each column represents a feature. From left to right, the first nine columns describe qualitative features, and the remaining columns describe quantitative features by representing beta value or normalized FPKM in the corresponding dataset. BE: basal epithelia, LE: luminal epithelia, FMSt: fibromuscular stroma. (B) Integrated genome view of the tag risk SNP rs6465657, the LD SNP rs6965016 and the adjacent regions in VCaP cells. RNA Pol II ChIA-PET and ChIP-Seq tracks for various factors in VCaP cells are shown. Additional LD SNPs are listed below the tag SNP track. (C) The mRNA abundance of LMTK2, BHLHA15 and TECPR1 in TCGA and CPC-GENE cohorts stratified by genotype for the LD SNP rs6965016. Boxplot represents median, 0.25 and 0.75 quantiles with whiskers at 1.5x interquartile range. mRNA abundance was measured in FPKM. Numbers next to genotypes reflect number of samples in each group. FDR was calculated by “BH” method, and β value were estimated from linear regression model. (D) Boxplots shows AR and H3K27ac ChIP-Seq signal intensity stratified by genotype for LD SNP rs6965016 in the Porto cohort (Mann-Whitney test of recessive model). Y-axis is the number of ChIP-Seq read counts mapped to LD SNP rs6965016 locus, which is normalized by TMM method.
