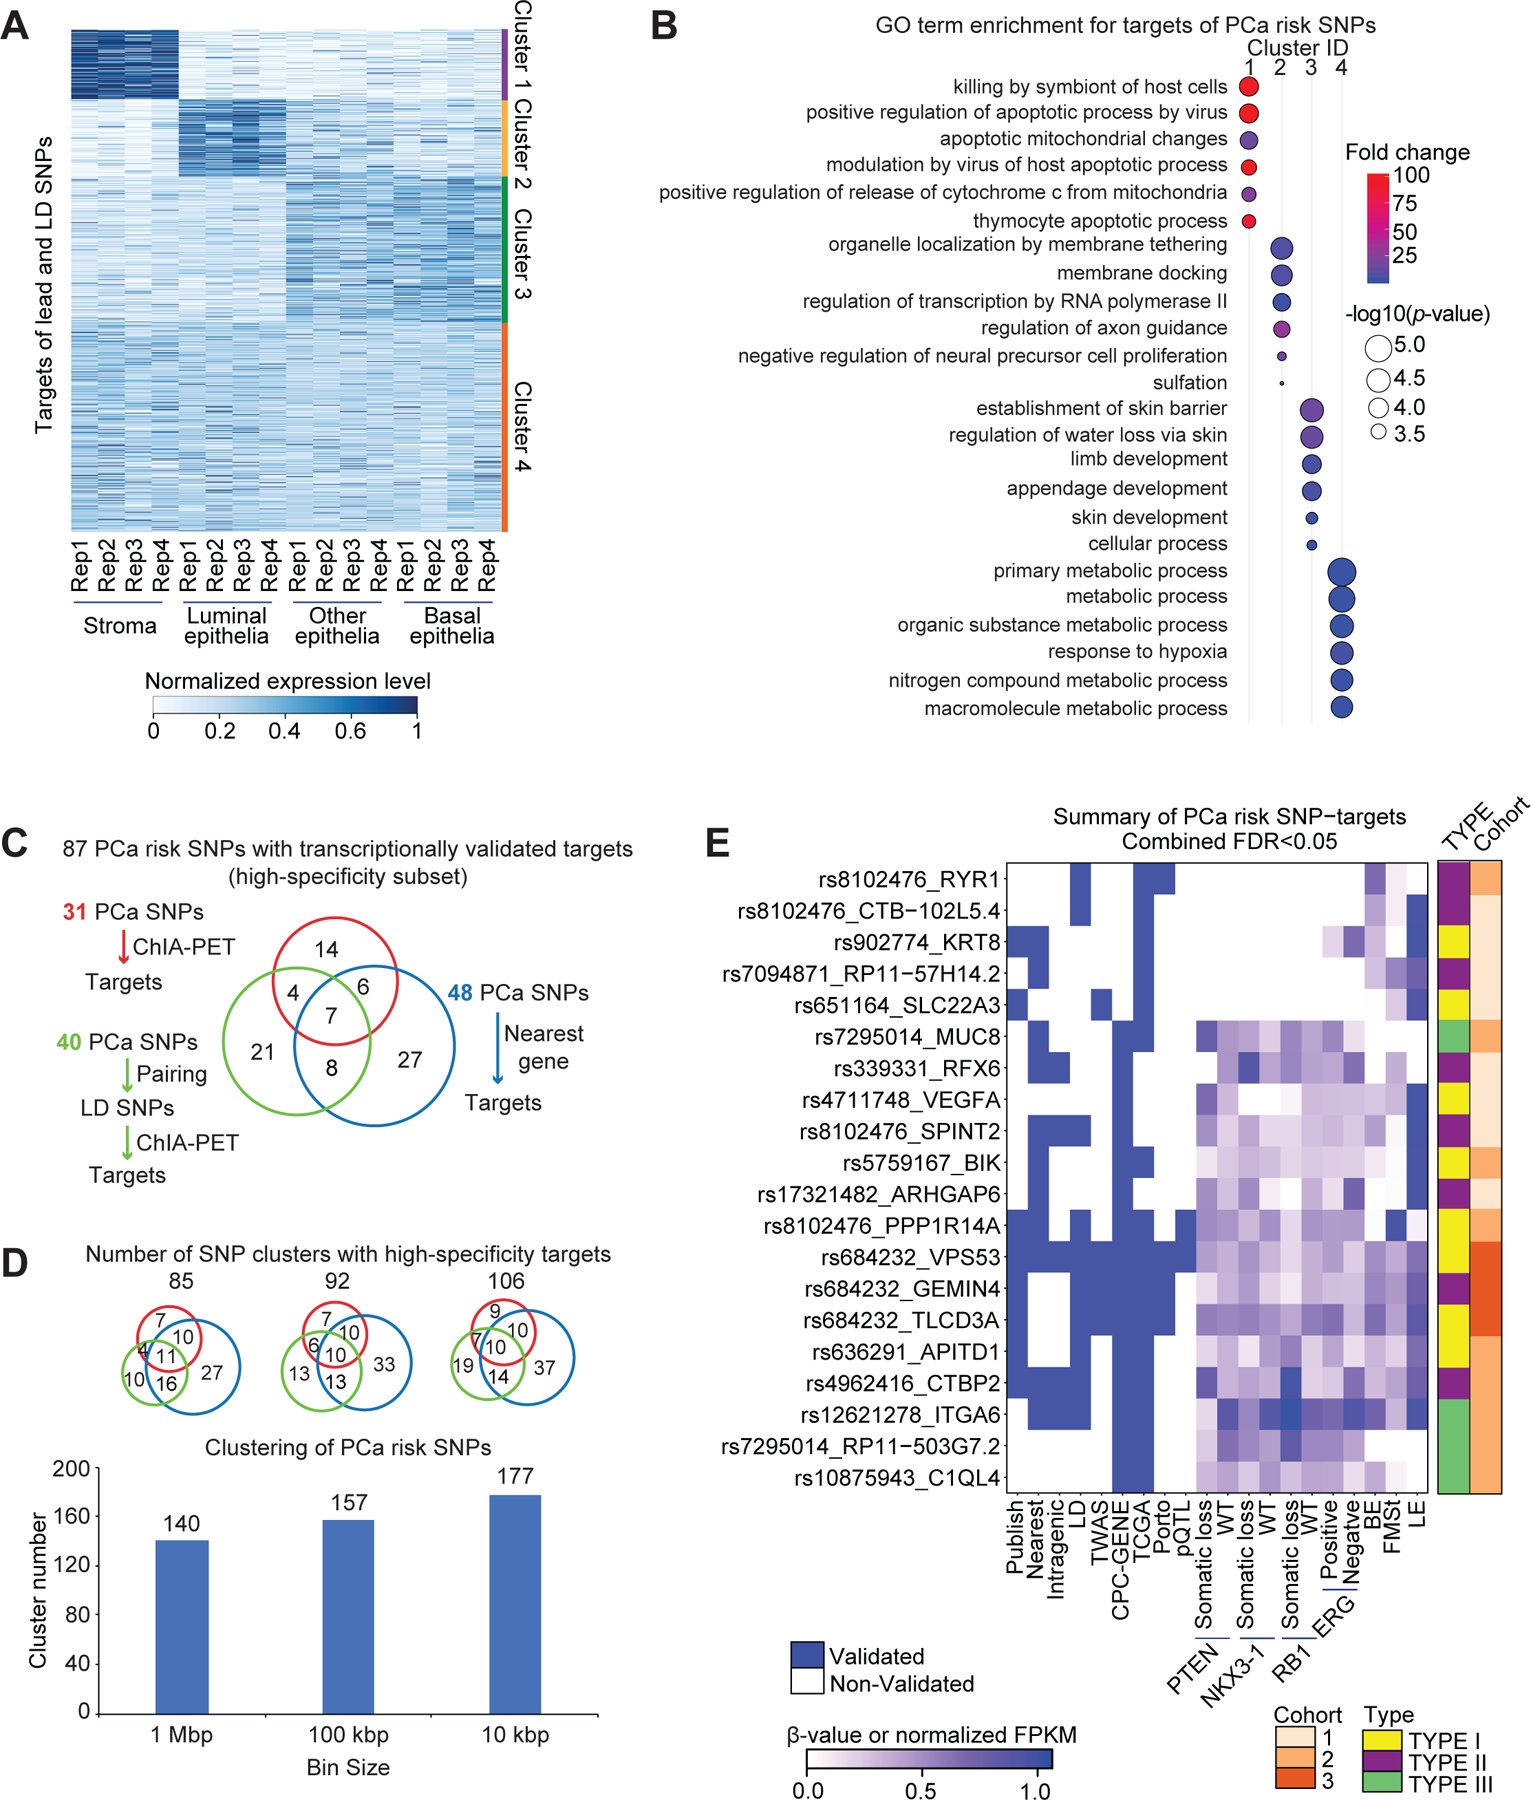
Figure 7. Cell-lineages and molecular pathways associated with the transcriptomic targets of PCa risk alleles.

(A) Expression patterns of high-sensitivity target genes of both tag SNPs and LD SNPs in the different cell lineages of the human prostate gland, including stroma, luminal epithelia, basal epithelia, and other epithelia. There are four replicates for each cell type. The expression level is represented by normalized FPKM, and the heatmaps were clustered by Jensen–Shannon divergence (JSD) method. (B) GO term enrichment for targets in each cluster. The p-values transformed by -log10, and fold change are represented by circle size, and color, respectively. (C) Number summary of PCa risk SNPs with transcriptionally validated targets by three strategies. (D) Clustering of PCa risk SNPs by setting different distance cutoffs, including 1 Mbp, 100 kbp and 10 kbp. Scaled Venn diagrams show the number of clusters with transcriptionally validated targets by three strategies. (E) Summary figure for the subset of high-specificity PCa SNP-target pairs (Fisher’s combined FDR < 0.05). Each row represents a SNP-target pair, and each column represents a feature. From left to right, the first nine columns describe qualitative features, and the remaining columns describe quantitative features by representing beta value or normalized FPKM in the corresponding dataset. BE: basal epithelia, LE: luminal epithelia, FMSt: fibromuscular stroma.
