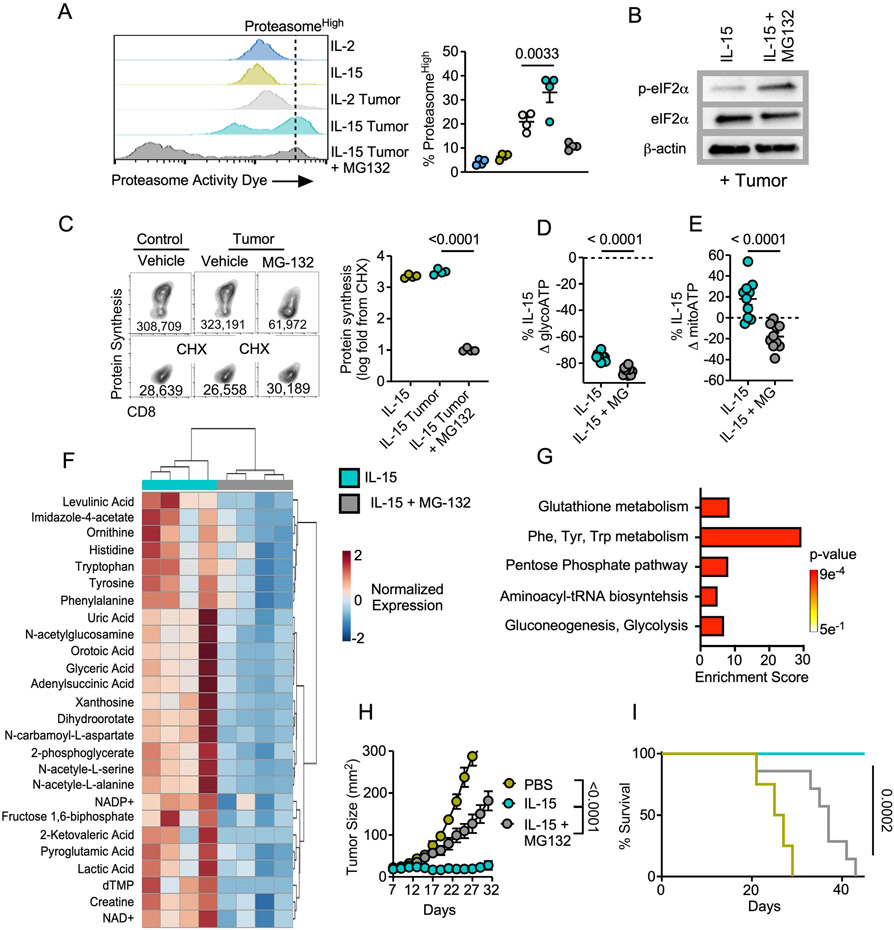
Figure 5. Proteasome function sustains translation and tumor immunity.
A) Representative histograms and quantification of the frequency of proteasome activityhigh cells from IL-2 or IL-15 conditioned OT-1 T harvested from the tumor-T cell coculture assay. Proteasome inhibitor MG-132 was added as an internal control 2-4 hours prior to cell harvest. B) Western blot analysis, C) representative FACS plots and quantification of protein synthesis rates, and percent change in D) glycolytic ATP or E) mitochondrial ATP of IL-15 conditioned OT1 T cells treated with MG-132 or vehicle for 2-4 hours prior harvest from the tumor-T cell transwells. F) Heatmap of significantly enriched metabolites and G) pathway enrichment analysis in IL-15 conditioned OT-1 T cells treated with vehicle relative to MG-132 for 2-4 hours prior to harvest from the tumor-T cell transwell assay. H) Tumor growth rate and I) overall survival from adoptive transfer of 7-day expanded IL-15 conditioned OT-1 T cells treated with MG-132 or vehicle control for 4 hours prior to transfer to B6 mice bearing 7-day established B16-F1-OVA melanomas. Data are representative of one to three independent experiments. p values are noted in each panel based on statistical analysis by one way ANOVA with Dunnett’s (A) or Tukey’s multiple comparison correction (C), unpaired Student’s t-test (D-E) or mixed linear regression (H) and log-rank, mantel-cox test of survival proportions (I), (N = 4-8 mice per group), error bars indicate the SEM. Criteria for significant differences in metabolite fold change > 2 and raw p-value < 0.1 (F, G).

