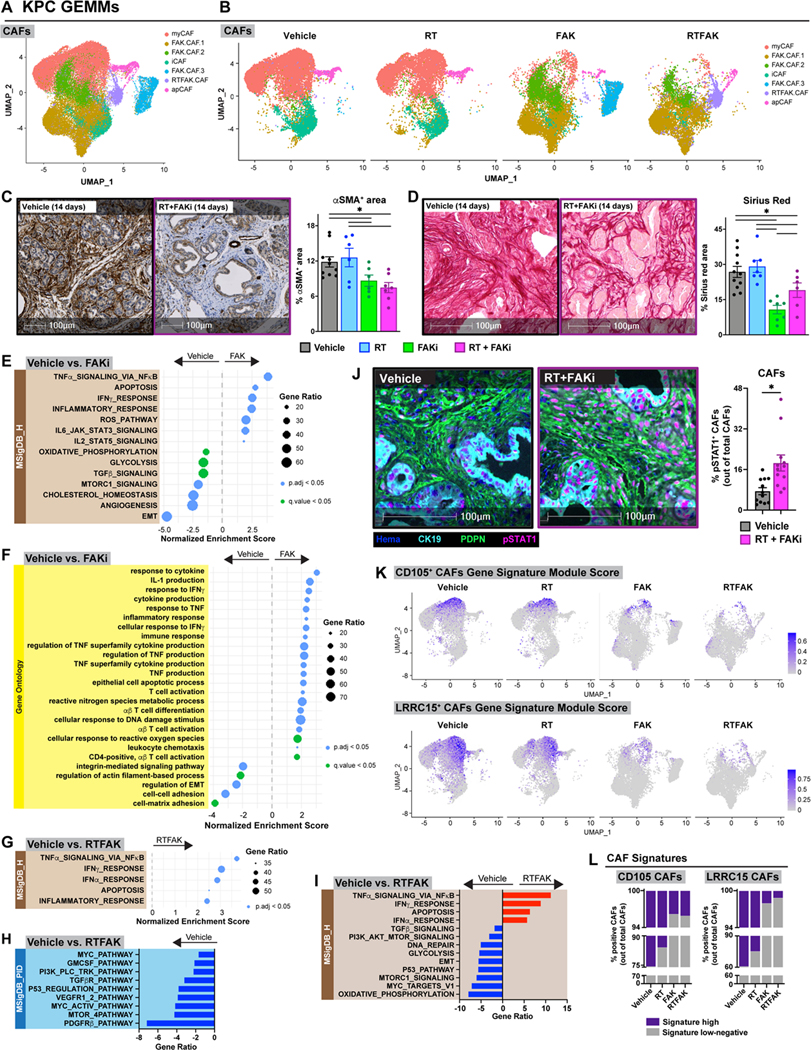
Figure 6: FAKi reshapes CAFs to participate in tumor immunity.

(A) UMAP dimensionality reduction plot of scRNA-seq data on CD45− CD31− Epcam− PDPN+ FACS-sorted CAFs-enriched from KPC mice at day 14 treated as depicted in Fig. 4A. Annotation shows different cell types. (B) UMAP distribution from (A) split by treatment conditions. (C-D) Analysis of αSMA IHC (C) and collagen density (D) on tissues from KPC mice 14 days post-RT start. Representative αSMA IHC and Sirius Red images are depicted. n = at least 7 mice/group. (E-F) Dot plot displaying GSEA results from MSigDB_Hallmark (E) and GO (F) databases. All graphs display comparisons of CAFs from vehicle to FAKi-treated mice. All pathways were filtered with p.adj value or q value < 0.05. (G-I) Dot plot displaying GSEA results from MSigDB_Hallmark database (G) and bar graphs displaying over-representation analysis of DEGs on CAFs in (A) to known biological functions in MSigDB_PID (H) and MSigDB_Hallmark (I) databases. All graphs display comparisons of CAFs from vehicle mice to RT+FAKi-treated mice. All pathways were filtered with p.adj value < 0.05. (J) mIHC analysis of CK19− PDPN+ pSTAT1+ cells in tissues of KPC mice from Fig. 4A. Representative CK19, PDPN, and pSTAT1 fused mIHC images are depicted. n = at least 6 mice/group. (K) UMAP representation of CD105+ CAFs or LRRC15+ CAFs gene signature module scores mapped onto CAFs in (A-B). (L) Quantification of CAFs in (A) for CD105+ CAFs gene signature or LRRC15+ CAFs gene signature.
All graphs depict mean +/− SEM. “*” denotes p < 0.05 by two-tailed t-test or one-way ANOVA as appropriate.
