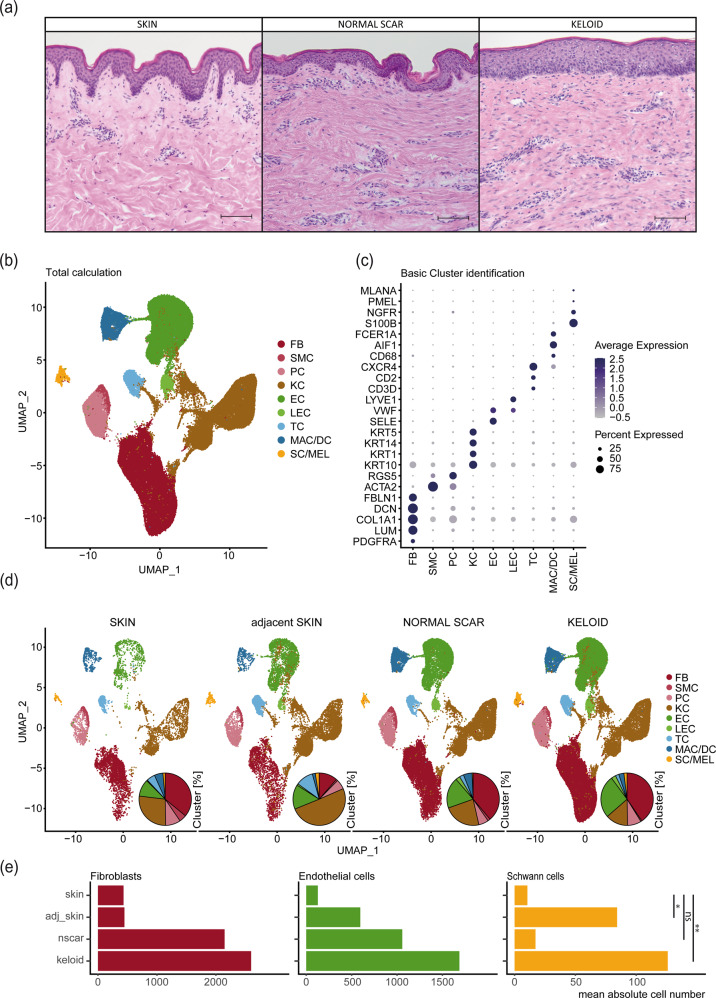
Fig. 2. Cellular composition of skin, normal scars, keloids, and keloid-adjacent skin.
a Hematoxylin-eosin staining of skin, normal scar, and keloid. Scale bars: 250 µm. b UMAP plot after integration of all datasets. Cluster identifications of fibroblasts (FB), smooth muscle cells (SMC), pericytes (PC), keratinocytes (KC), endothelial cells (EC), lymphatic endothelial cells (LEC), T cells (TC), macrophages and dendritic cells (MAC/DC), Schwann cells and melanocytes (SC/MEL). c Dot plots showing well-known marker genes to characterize clusters: PDGFRA, LUM, COL1A1, DCN, FBLN1 for FB, ACTA2, RGS5 for SMC and PC, KRT10, KRT1, KRT14, KRT5 for KC, SELE, VWF for EC, LYVE1 for LEC, CD3D, CD2, CXCR4 for TC, CD68, AIF1 for MAC, FCER1A for DC, S100B, NGFR for SC, PMEL, MLANA for MEL; Dot size symbolizes percentage of cells expressing the gene, color gradient represents average gene expression. d Split UMAP plots show the cellular composition within each tissue. Pie plots depict the relative amounts of each cell type within a tissue. e Bar plots depict arithmetic means of the absolute numbers of FB, EC, and SC within each condition. Asterisks represent p-values: *p < 0.05, **p < 0.01, ***p < 0.001, ns: not significant.

