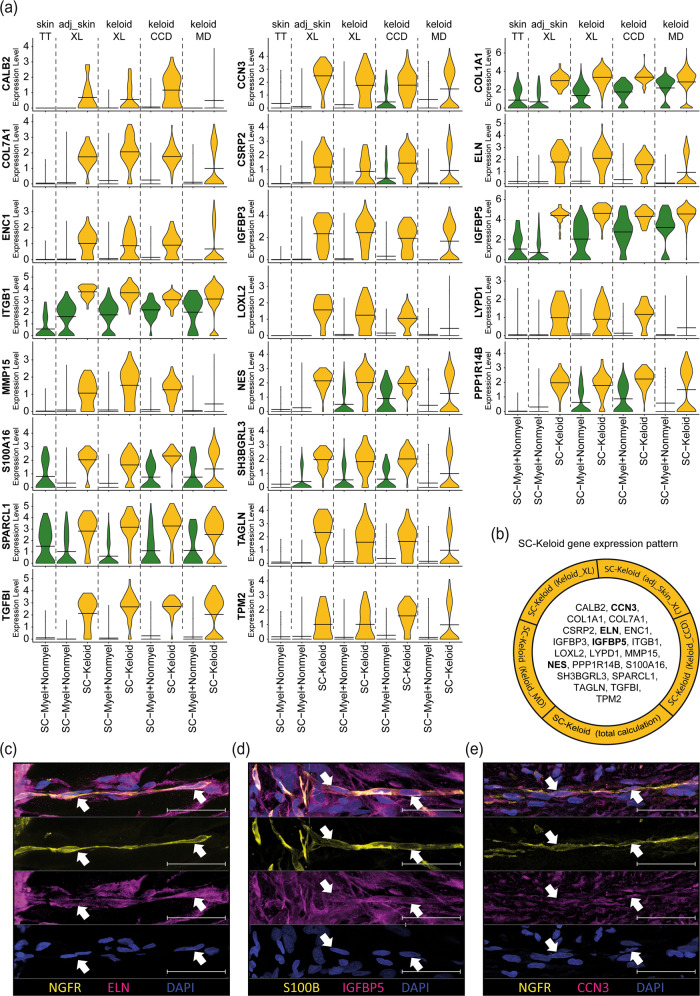
Fig. 5. Individual dataset combinations reveal the gene expression pattern of keloidal profibrotic Schwann cells.
a Violin plots of corresponding, meaningful genes detected in all individual top 100 gene lists comparing keloidal Schwann cells (SC-Keloid) with mature Schwann cells (myelinating and nonmyelinating Schwann cells). Data sources: Tracy Tabib et al., 2018 (TT)18; Xuanyu Liu et al., 2021 (XL)15, Cheng-Cheng Deng et al., 2021 (CCD)16, Martin Direder et al., 2021 (MD)17; adjacent skin (adj_skin); Crossbeams show mean expression values; maximum expression is depicted by vertical lines; frequency of cells with the respective expression level is shown by violin width; myelinating Schwann cells (SC-Myel); nonmyelinating Schwann cells (SC-Nonmyel, SC-Nonmyel2), myelination and nonmyelinating Schwann cell mixed cluster (SC-Myel+Nonmyel); keloidal Schwann cells (SC-Keloid); proliferating Schwann cells (SC-Prolif), cells expressing Schwann cell and endothelial cell-specific genes (SC-EC); cells expressing Schwann cell and fibroblast-specific genes (SC-FB). b List of all members from the SC-Keloid gene expression pattern. mRNAs in bold have been verified at the protein level. c–e Immunofluorescence staining of keloidal Schwann cells visualized by S100B or NGFR (yellow) in combination with ELN, IGFBP5 or CCN3. Arrowheads indicate double-positive Schwann cells. Nuclei were stained with DAPI (blue). Scale bars: 50 µm.

