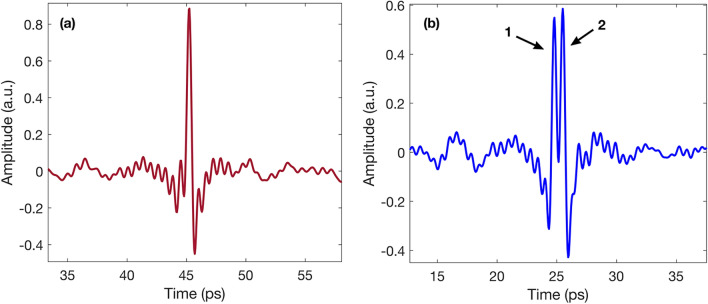
Figure 5.
Comparison of regular and irregular waveforms for the mapping algorithm. (a) Shows a regular waveform corresponding to an area on the painting where the layers were homogeneous and no irregularities were present. (b) Shows an example of an irregular waveform, where layer detachment is denoted by the two peaks located between 20–30 ps. As peak 2 has an amplitude greater than 80% of peak 1, the algorithm saved the coordinates of this waveform.

