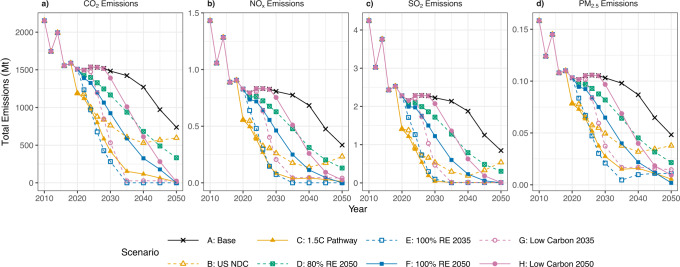
Fig. 2. National operating emissions across scenarios 2010–2050 (megatonnes, Mt).
The emissions shown here are: a CO2 operating emissions, b NOx operating emissions, c SO2 operating emissions, and d PM2.5 operating emissions. Note that the y-axes are not consistent. We see the base case (black line) as an upper bound on all emissions types and Scenarios C (solid yellow line) and E (dotted blue line) as a lower bound across all emissions types. Scenario E emissions reach close to zero by 2035, its mandate year, and remains close to zero by 2035–2050 for CO2, NOx, and SO2 emissions. However, PM2.5 emissions in Scenario E rise because of investments in biopower, which help maintain the 100% renewable grid but still have co-pollutants that will be emitted.

