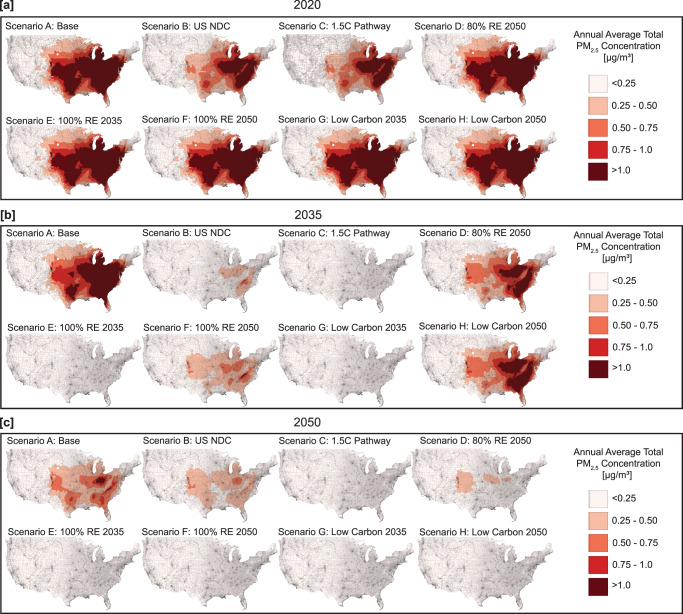
Fig. 3. Regional distribution of PM2.5 across decarbonization scenarios for 2020, 2035, and 2050.
Total PM2.5 air pollution from power plants across scenarios: a 2020, b 2035, and c 2050. By 2035, the only scenarios with 100% of regions below the threshold of 0.25 µg/m3 include the aggressive carbon cap (Scenario C) and the ones with a technology mandate with a 2035 goal of 100% low carbon or renewable technologies (Scenarios E and G). The distribution of NOx and SO2 for 2020, 2035, and 2050 can be found in SI Figs. S-8 and S-9.

