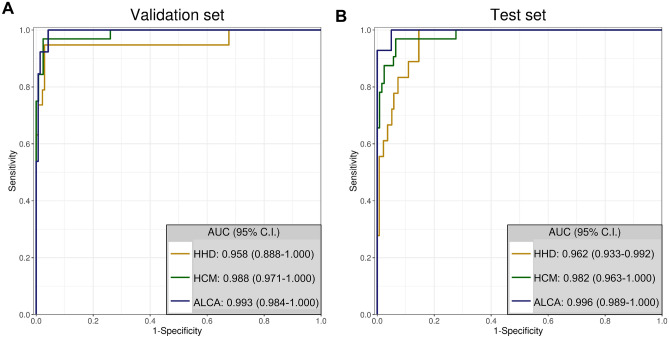
Figure 2.
ROC curve analysis of the deep learning algorithm for the differential diagnosis of LVH. The diagnostic accuracy of the deep learning algorithm was calculated using the AUC for the validation (A), and test sets (B). This figure was generated using R software v.4.1.1, R Core Team (2021). R: A language and environment for statistical computing. R Foundation for Statistical Computing, Vienna, Austria. URL http://www.r-project.org/. AUC area under the ROC curve, CI confidence interval, ALCA light-chain cardiac amyloidosis, HCM hypertrophic cardiomyopathy, HHD hypertensive heart disease, ROC receiver operating characteristic curve.

