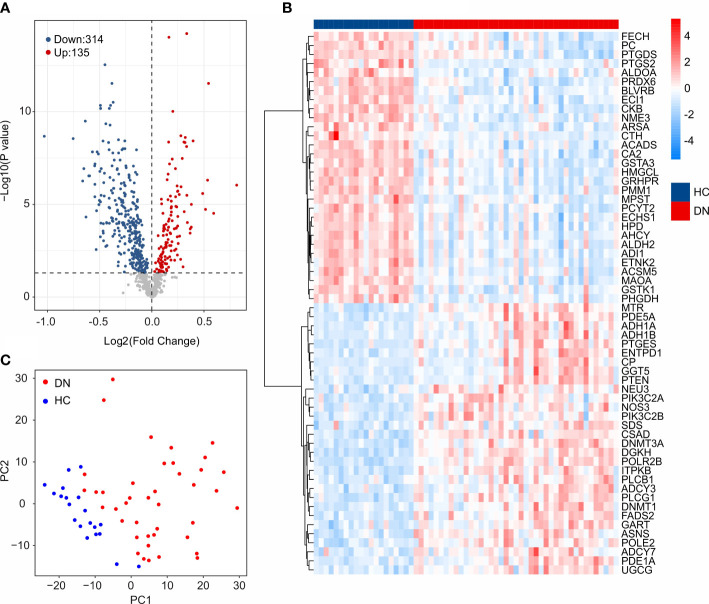
Figure 2.
Identification of DE-MRGs. (A) Volcano diagram shows the DEGs in HC and DN group. The threshold for screening the DEGs is set at |Fold Change| ≥ 1 and P -value < 0.05. (B) Heatmap shows the top 30 up-regulated and down-regulated DE-MRGs in HC and DN group. (C) Principal component analysis illustrates a significant difference between the HC and DN samples based on the MRGs.

