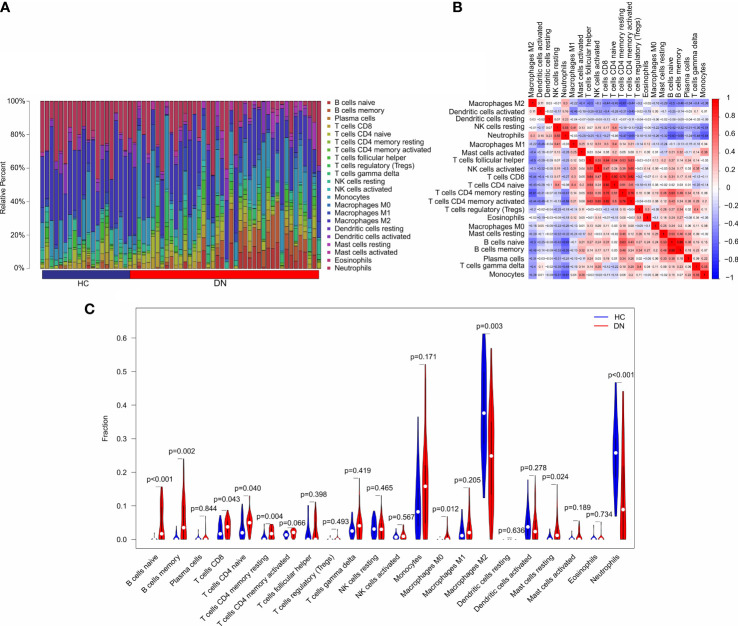
Figure 6.
Immune infiltration analysis in HC and DN group. (A) Bar plot shows the fraction of the 22-types immune cells in the HC and DN group. (B) Correlation analysis of the 22-types immune cells. (C) Violin diagram shows the fraction of 22-type immune cells in HC and DN group based on the CIBERSORT algorithm.

